The difference between investors who build generational wealth and those who lose their shirts comes down to one critical skill: proper underwriting.
I’ve seen it countless times over my 40+ years in real estate. Smart, capable people get excited about a deal, fall in love with a property, and then try to make the numbers work. That’s backwards—and it’s expensive.
Professional investors do it differently. We let the numbers tell us whether a deal deserves our attention. The spreadsheet doesn’t lie, and it certainly doesn’t care about your feelings.
I’m Rod Khleif, and I’ve personally owned over 2,000 rental properties and apartment buildings. I’ve also made every underwriting mistake you can imagine—including losing $50 million in the 2008 crash, partially because I got aggressive with my assumptions.
What I’m about to share with you is the exact underwriting process that my Warrior Program students use to analyze deals. These same students now collectively own over 260,000 apartment units. This framework works whether you’re looking at your first 8-unit building or a 200-unit value-add opportunity.
Let me walk you through how to underwrite a multifamily deal step-by-step, so you can evaluate properties with the confidence of a seasoned pro.
What Is Multifamily Underwriting (And Why It Matters)
Underwriting is the process of analyzing a property’s financial performance to determine if it meets your investment criteria. It’s how you separate good deals from disasters before you put a single dollar at risk.
Think of underwriting as your financial defense system. It answers critical questions like:
- What is this property actually worth?
- What returns can I realistically expect?
- What could go wrong, and can the deal survive it?
- How much should I offer to hit my target returns?
Here’s what most new investors don’t understand: the seller’s pro forma is a sales document, not a financial analysis.It’s designed to make the property look as attractive as possible. Your job as an investor is to reconstruct reality using conservative assumptions backed by actual market data.
When you master underwriting, you gain the power to:
- Evaluate dozens of deals quickly and identify the best opportunities
- Make confident offers knowing exactly what the property is worth
- Present compelling opportunities to investors with bulletproof numbers
- Protect yourself from overpaying or buying a money pit
(Learn more about finding and analyzing multifamily deals like a pro.)
The Documents You Need Before You Start
You can’t underwrite what you can’t see. Before you open a spreadsheet, request these documents from the seller or broker:
Essential Documents:
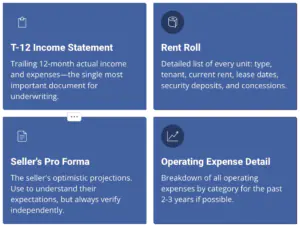
1. Trailing 12-Month (T-12) Income Statement
This shows actual income and expenses for the past year. It’s the single most important document for underwriting.
2. Rent Roll
A detailed list of every unit showing:
- Unit number and type (1BR, 2BR, etc.)
- Tenant name
- Current rent
- Lease start and end dates
- Security deposits
- Any concessions or special terms
3. Pro Forma (Seller’s Projections)
The seller’s optimistic projections. Use this to understand what they think the property can do, but always verify with your own analysis.
4. Operating Expense Detail
Breakdown of all operating expenses by category for the past 2-3 years if possible.
5. Current Leases
Especially important for properties with commercial space or unique lease structures.
6. Utility Bills
Who pays what? Are utilities separately metered or master metered?
7. Capital Expenditure History
What major repairs or improvements have been done recently? What’s still needed?
8. Delinquency Report
How much rent is currently uncollected?
Once you have these documents, you’re ready to start the underwriting process. (Access Rod’s free multifamily deal analyzer to streamline your analysis.)
Step 1: Analyze Current Income (What’s Really Coming In)
Income is the foundation of your entire underwriting. Get this wrong, and everything downstream breaks.
Gross Potential Rent (GPR)
Start with the rent roll. For each unit type, calculate the average current rent:
Example:
- 20 one-bedroom units at an average of $1,200/month
- 15 two-bedroom units at an average of $1,500/month
Monthly GPR = (20 × $1,200) + (15 × $1,500) = $24,000 + $22,500 = $46,500
Annual GPR = $46,500 × 12 = $558,000
Market Rent Analysis
Now compare current rents to market rates. Use:
- Recent comps from similar properties
- Rent.com, Apartments.com, Zillow data
- Broker market reports
- Direct calls to competing properties
If current rents are below market, you’ve identified upside potential. If they’re above market, that’s a red flag.
Conservative approach: Don’t assume you can immediately raise rents to market. Factor in lease rollover timing and potential tenant pushback.
Other Income
Don’t forget secondary income sources:
- Laundry income
- Parking fees
- Pet fees/pet rent
- Utility reimbursements (RUBS)
- Storage unit rentals
- Vending machines
- Late fees
Critical rule: Verify other income against the T-12 statement. Sellers often inflate these projections.
Loss to Lease
If current rents are significantly below market, calculate your “loss to lease”—the difference between what you’re collecting and what you could collect at market rates.
This represents your value-add opportunity, but be realistic about how quickly you can capture it.
Step 2: Calculate Vacancy and Credit Loss
No property stays 100% occupied 100% of the time. Vacancy and credit loss accounts for:
- Turnover between tenants
- Units undergoing renovation
- Uncollected rent from delinquent tenants
- Concessions or rent discounts
How to Set Your Vacancy Rate
Don’t just guess. Your vacancy assumption should be based on:
- Historical performance: What does the T-12 show for actual vacancy?
- Market conditions: What’s the submarket vacancy rate?
- Property condition: Class A properties typically have lower vacancy than Class C
- Your business plan: Planning major renovations? Factor in higher vacancy
Conservative guidelines:
- Strong market, stabilized property: 5-7%
- Average market or property: 7-10%
- Weak market or heavy value-add: 10-15%
Example:
Annual GPR: $558,000
Vacancy (8%): -$44,640
Effective Gross Income: $513,360
Never use less than 5% vacancy unless you have exceptional justification. Properties with claimed 95%+ occupancy still need reserve for turnover.
Step 3: Underwrite Operating Expenses (Where Money Disappears)
This is where inexperienced investors get destroyed. They underestimate expenses, the property underperforms, and suddenly there’s no cash flow.
The Major Expense Categories
1. Property Taxes
- Use actual tax bills, not seller projections
- Research if the property will be reassessed after sale
- Some jurisdictions reassess at sale price, dramatically increasing taxes
- Don’t forget to account for annual tax increases (typically 2-4%)
2. Insurance
- Get actual quotes from insurance brokers
- Consider flood insurance if in a flood zone
- Umbrella liability coverage
- Budget for annual increases
3. Utilities
- Water/sewer (often master metered in older properties)
- Electricity for common areas
- Gas for heating
- Trash removal
Carefully review who pays what. If tenants pay their own utilities, these expenses should be minimal. If master metered, utilities can be a massive expense line.
4. Property Management
- Typically 3-10% of collected income
- Don’t skip this even if you plan to self-manage
- Your time has value, and you need reserves if you can’t manage anymore
5. Repairs and Maintenance
- Ongoing repairs: plumbing, electrical, HVAC, appliances
- Grounds maintenance, snow removal, landscaping
- Pest control
- Budget $250-500 per unit per year for stabilized properties
- Higher for older properties or heavy value-add
6. Payroll (if applicable)
- On-site manager
- Maintenance staff
- Leasing agents
- Don’t forget payroll taxes and benefits
7. Administrative Expenses
- Legal and accounting
- Licenses and permits
- Office supplies
- Marketing and advertising
- HOA fees (if applicable)
8. Reserves for Replacements (CapEx)
This is NOT an operating expense for NOI calculation, but you must budget for it:
- Roof replacement
- HVAC systems
- Water heaters
- Parking lot resurfacing
- Exterior paint
Budget $200-500 per unit per year depending on property age and condition.
Understanding Expense Ratios
Expense Ratio = Operating Expenses ÷ Gross Potential Income
Typical ranges:
- Class A properties: 35-45%
- Class B properties: 40-50%
- Class C properties: 45-55%+
If a seller’s pro forma shows expenses significantly below these ranges, they’re likely underestimating.
Example:
Gross Potential Income: $558,000
Estimated Operating Expenses: $251,100
Expense Ratio: $251,100 ÷ $558,000 = 45%
(Use Rod’s commercial real estate underwriting tool to calculate expense ratios instantly.)
Step 4: Calculate Net Operating Income (NOI)
Now we get to the number that determines property value: Net Operating Income.
NOI = Effective Gross Income – Operating Expenses
Using our example:
Effective Gross Income: $513,360
Operating Expenses: -$251,100
Net Operating Income (NOI): $262,260
What NOI Tells You
NOI represents the property’s ability to generate income before debt service. This is what lenders and appraisers focus on.
Critical point: NOI excludes:
- Mortgage payments (debt service)
- Capital expenditures
- Depreciation
- Income taxes
Stabilized vs. Proforma NOI
Current/Stabilized NOI: Based on actual current income and conservative expense estimates
Proforma/Forward NOI: Based on projected income after you execute your business plan (rent increases, expense reductions, etc.)
Always underwrite to both. Your purchase price should be based on current NOI. Your projected returns should be based on proforma NOI, but stress-tested conservatively.
Step 5: Determine Property Value Using Cap Rate
The capitalization rate (cap rate) is how you convert NOI into property value.
Property Value = NOI ÷ Cap Rate
How to Determine the Right Cap Rate
1. Market Comps
What are similar properties selling for in the same submarket?
2. Broker Market Reports
Marcus & Millichap, CBRE, Colliers publish quarterly cap rate reports by market
3. Property Class Adjustments
- Class A: Lower cap rates (4-6%)
- Class B: Mid-range cap rates (6-8%)
- Class C: Higher cap rates (8-10%+)
4. Risk Adjustment
Higher risk = higher cap rate required
Example:
Current NOI: $262,260
Market Cap Rate: 7.0%
Property Value: $262,260 ÷ 0.07 = $3,746,571
If the seller is asking $4.2 million, you’re looking at a significant overpayment unless you can justify it with value-add upside.
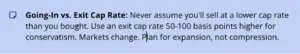
Going-In vs. Exit Cap Rate
Going-In Cap Rate: Based on current NOI at purchase
Exit Cap Rate: What you assume when you sell (typically 50-100 basis points higher for conservatism)
Never assume you’ll sell at a lower cap rate than you bought. Markets change, and conservative underwriting means planning for expansion, not compression.
Step 6: Model Rent Growth (The Value-Add Opportunity)
If you’re pursuing a value-add strategy, rent growth modeling is critical.
Types of Rent Growth
1. Market Rent Growth
Natural appreciation due to market conditions
- Conservative: 2-3% annually
- Use historical data for the submarket
2. Loss-to-Lease Capture
Bringing below-market units to market rates
- Model this over 12-36 months depending on lease rollover
- Don’t assume 100% capture—some tenants will leave rather than pay more
3. Value-Add Renovations
Rent premiums from unit upgrades
- Requires unit-by-unit analysis
- Factor in renovation costs, timeline, and vacancy during renovation
How to Model Rent Growth Conservatively
Let’s say you have a 35-unit property:
Year 1:
- 10 units at market, staying flat
- 15 units below market by $100/month → capture $75/month increase (75% capture)
- 10 units to be renovated → increase by $150/month after $8,000 renovation
Calculation:
- Current rent: $45,000/month
- Year 1 additional income:
- Loss to lease: 15 units × $75 × 12 months = $13,500
- Renovations: 10 units × $150 × 6 months average = $9,000
- Year 1 total increase: $22,500
Critical assumptions to document:
- What percentage of tenants will accept rent increases?
- How long does each renovation take?
- What’s your vacancy during renovation?
- What if renovation costs run over budget?
Step 7: Stress Testing Your Underwriting
This is where professionals separate themselves from amateurs. Anyone can make a deal work with aggressive assumptions. The question is: does it work when things go wrong?
Key Stress Tests to Run
1. Expense Shock Test
Increase all operating expenses by 10-20%
- What if property taxes increase after reassessment?
- What if insurance costs spike?
- What if you have higher-than-expected maintenance?
If the deal breaks with a 15% expense increase, it’s too risky.
2. Income Reduction Test
Decrease income by 10%
- What if you can’t fill units as quickly as planned?
- What if market rents soften?
- What if renovation premiums are lower than expected?
3. Higher Interest Rate Test
Model debt service at 100-200 basis points higher than quoted
Interest rates change. Bridge loans reset. What if your refi rate is higher than expected?
4. Extended Timeline Test
What if your value-add takes 24 months instead of 12?
- More interest carry
- More lost rent during renovation
- Higher operating costs
5. Exit Cap Rate Expansion
Model your exit at 50-100 basis points higher than current market
Cap rates compress in good times and expand in bad times. Conservative underwriting plans for expansion.
The “Disaster Scenario” Test
I always run one nightmare scenario:
- Vacancy up to 15%
- Expenses up 20%
- Rent growth zero
- Exit cap rate up 100 basis points
If the deal still produces some return in this scenario, you have downside protection. If it’s a total disaster, you’re taking on too much risk.
(Discover how Rod analyzed a $65M deal in Savannah and walked away due to conservative stress testing.)
Step 8: Sensitivity Analysis (Understanding Your Risk Exposure)
While stress testing looks at specific scenarios, sensitivity analysis shows you how changes in key variables impact your returns across a range of outcomes.
Key Variables to Analyze
1. Exit Cap Rate Sensitivity
Model your IRR and equity multiple at exit cap rates of:
- 6.5%, 7.0%, 7.5%, 8.0%, 8.5%
This shows you how sensitive your returns are to market conditions at exit.
2. Rent Growth Sensitivity
Model annual rent growth at:
- 0%, 1%, 2%, 3%, 4%
If you need 4% annual rent growth to hit your targets, but historical market average is 2%, you’re in trouble.
3. Renovation Premium Sensitivity
If you’re underwriting a $150/month rent increase from renovations, model:
- $100, $125, $150, $175, $200
What if you only capture $100? Does the deal still work?
4. Occupancy Sensitivity
Model stabilized occupancy at:
- 85%, 90%, 92%, 95%, 97%
Creating a Sensitivity Table
Build a simple table showing IRR outcomes:
| Exit Cap 6.5% | Exit Cap 7.0% | Exit Cap 7.5% | Exit Cap 8.0% | |
|---|---|---|---|---|
| 2% Rent Growth | 16.2% IRR | 14.8% IRR | 13.1% IRR | 11.7% IRR |
| 3% Rent Growth | 18.5% IRR | 16.9% IRR | 15.2% IRR | 13.8% IRR |
| 4% Rent Growth | 20.9% IRR | 19.1% IRR | 17.3% IRR | 15.7% IRR |
This shows you the range of potential outcomes and helps you understand where your assumptions need to be most accurate.
Step 9: Debt Service Coverage and Financing Analysis
Even if a property has strong NOI, it needs to support the debt you’re putting on it.
Debt Service Coverage Ratio (DSCR)
DSCR = NOI ÷ Annual Debt Service
Most lenders require:
- Minimum 1.20x DSCR (agency debt)
- Minimum 1.25x DSCR (portfolio/bridge loans)
Example:
NOI: $262,260
Annual debt service: $210,000
DSCR: $262,260 ÷ $210,000 = 1.25x
This property can support the proposed debt.
Loan-to-Value (LTV) Constraints
Lenders also limit how much they’ll lend based on property value:
- Agency debt (Fannie/Freddie): up to 80% LTV
- Bridge loans: 70-75% LTV
- Value-add loans: 65-70% LTV plus rehab budget
Example:
Appraised value: $3,750,000
75% LTV: $2,812,500 max loan
Cash-on-Cash Return
After accounting for debt service, what return do you generate on your actual cash invested?
Cash-on-Cash Return = Annual Cash Flow ÷ Total Cash Invested
Example:
Purchase price: $3,750,000
Down payment (25%): $937,500
Closing costs: $75,000
Total cash invested: $1,012,500
Annual NOI: $262,260
Annual debt service: -$210,000
Annual cash flow: $52,260
Cash-on-Cash: $52,260 ÷ $1,012,500 = 5.16%
Target minimum: 8-10% cash-on-cash for value-add deals
Step 10: Building Your Underwriting Model
You can create an underwriting model in Excel or use specialized software. Here’s the structure:
Inputs Section
- Purchase price
- Closing costs
- Loan terms (rate, amortization, LTV)
- Unit mix and current rents
- Market rents by unit type
- Operating expense assumptions
- Renovation costs and timeline
- Rent increase assumptions
- Hold period and exit cap rate
Calculations Section
- Current and proforma income
- Vacancy loss
- Effective gross income
- Operating expenses by category
- NOI (current and proforma)
- Debt service
- Cash flow
- CapEx reserves
Returns Section
- Cash-on-cash return
- IRR (Internal Rate of Return)
- Equity multiple
- Total profit
- Average annual return
Sensitivity Tables
- Exit cap rate sensitivity
- Rent growth sensitivity
- Expense sensitivity
(Get started with Rod’s free multifamily deal analyzer that includes all these calculations pre-built.)
Red Flags to Watch For
After underwriting thousands of deals, here are the warning signs I’ve learned to never ignore:
Seller Red Flags
1. Seller Won’t Provide T-12 or Rent Roll
If they won’t show you actual performance, there’s a reason. Walk away.
2. Pro Forma Shows Unrealistic Expense Ratios
Expenses at 30% for a Class B property? They’re lying or clueless. Either way, bad news.
3. “Market Rent” Claims Without Comps
Seller says units should rent for $1,800 but provides no proof? Do your own research.
4. Deferred Maintenance Everywhere
If the roof, HVAC, and parking lot all need replacement, factor those costs or walk.
Deal Structure Red Flags
1. Returns Only Work with Aggressive Assumptions
If you need 5% annual rent growth and a compressed exit cap to hit your targets, you’re gambling, not investing.
2. Negative Leverage
If your cap rate is lower than your interest rate, the debt is hurting returns, not helping.
3. No Margin for Error
If a 10% expense increase kills the deal, you have no downside protection.
4. Relying on Market Appreciation
Your underwriting should work based on income alone. Appreciation is a bonus, not the strategy.
(Learn about multifamily underwriting fundamentals from Rod’s podcast with Adam Wolfson.)
The Underwriting Checklist: Your Step-by-Step Process
Here’s the exact checklist I use (and my Warrior students use) for every deal:
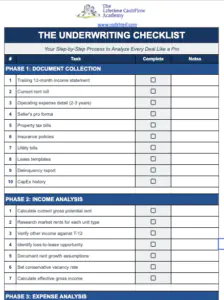
Download the Complete Multifamily Underwriting Checklist (PDF)
Common Underwriting Mistakes (And How to Avoid Them)
Mistake #1: Using the Seller’s Numbers
The Problem: Seller pro formas are sales documents designed to maximize perceived value.
The Solution: Build your own model from scratch using the T-12 as your starting point. Trust but verify every assumption.
Mistake #2: Underestimating Expenses
The Problem: New investors consistently underbudget expenses, especially maintenance, CapEx, and property taxes.
The Solution: Use conservative expense ratios based on property class. Get actual quotes for taxes and insurance. Budget high for maintenance and CapEx.
Mistake #3: Overly Aggressive Rent Growth
The Problem: Assuming you can immediately raise rents to market or that markets will grow 5% annually.
The Solution: Phase rent increases over 12-36 months. Use historical market data for growth rates (typically 2-3%). Stress test with zero growth.
Mistake #4: Ignoring CapEx
The Problem: Focusing only on NOI and forgetting that roofs, HVAC systems, and parking lots eventually need replacement.
The Solution: Always budget $200-500/unit/year for capital reserves. Inspect the property and create a CapEx plan.
Mistake #5: Falling in Love with a Property
The Problem: Wanting a deal to work so badly that you rationalize aggressive assumptions.
The Solution: Underwrite deals emotionlessly. The numbers either work or they don’t. Be willing to walk away from 90% of what you analyze.
Advanced Underwriting: Taking It to the Next Level
Once you master the basics, here are advanced techniques:
Unit-by-Unit Rent Roll Analysis
Don’t just average rents. Analyze each unit:
- Which specific units are below market?
- Which leases are expiring when?
- What’s the rollover strategy for maximum rent capture?
Submarket Analysis
Understand micro-market dynamics:
- What’s being built nearby?
- Are employers moving in or out?
- What’s the 3-mile radius vacancy trend?
- What are rent growth rates specifically in this submarket?
Utility Reimbursement Strategies (RUBS)
If utilities are master-metered, implementing RUBS (Ratio Utility Billing System) can shift $200-500/month per unit in expense to tenants.
Model the income impact but factor in implementation costs and potential tenant pushback.
Value-Add Business Plan Modeling
For heavy value-add deals:
- Create a 36-month renovation schedule
- Model month-by-month cash flow
- Factor in construction loan draw schedules
- Account for vacancy during renovation
- Build in contingency buffers (15-20% of renovation budget)
(Master these techniques at Rod’s Underwriting & Due Diligence Bootcamp.)
Tools and Resources for Better Underwriting
Software and Calculators
Free Tool:
Paid Software:
- RealData (comprehensive underwriting and market analysis)
- Argus (enterprise-level software for large deals)
- PropertyMetrics (Excel-based underwriting templates)
Market Research Resources
- CoStar (commercial real estate data)
- Local apartment association reports
- Census data for employment and demographics
- Rentometer, Rent.com, Apartments.com for rent comps
- County assessor websites for property tax research
Education
- Rod Khleif’s Virtual Multifamily Bootcamp
- Warrior Program Mentorship (includes unlimited deal analysis)
- Lifetime Cash Flow Through Real Estate Investing Podcast
Putting It All Together: A Real Example
Let’s walk through a simplified real-world underwriting:
Property: 42-unit Class B multifamily
Asking Price: $4,200,000
Location: Growing secondary market
Current Performance (from T-12):
- Gross Rent: $468,000
- Other Income: $12,000
- Vacancy: $28,800 (6%)
- Operating Expenses: $216,000 (45% expense ratio)
- Current NOI: $235,200
Your Analysis:
Income:
- Market rents $100/month higher on average
- 15 units below market (rollover opportunity)
- Conservative capture: $75/month × 15 units × 12 months = $13,500 additional
- Realistic timeline: 24 months
- Year 2 stabilized income increase: $13,500
Expenses:
- Property taxes will increase 15% upon sale = +$12,000
- Insurance quote came in 20% higher = +$6,000
- Maintenance budget increase for deferred items = +$8,000
- Proforma operating expenses: $242,000
- Expense ratio: 50% (acceptable for Class B)
Proforma NOI (Year 2):
- Gross income: $493,500
- Vacancy (7%): -$34,545
- Effective gross income: $458,955
- Operating expenses: -$242,000
- Proforma NOI: $216,955
Valuation:
- Current NOI: $235,200
- Market cap rate: 7.5%
- Current value: $235,200 ÷ 0.075 = $3,136,000
- Offering price maximum: $3,100,000 (5% discount for negotiation room)
The Decision:
Asking price is $4.2M. Current value is $3.1M. Even with the value-add upside, there’s over $1M of overpricing. Pass on this deal or submit a significantly lower offer knowing it will likely be rejected.
This is how professional underwriting protects you from overpaying.
Your Next Steps: From Analysis to Action
Underwriting is a skill that improves with practice. Here’s how to get started:
Immediate Actions (This Week):
- Download the underwriting checklist above and save it as your template
- Find 3 deals to analyze on LoopNet, Crexi, or through a broker
- Request financials from sellers/brokers (even if you’re not ready to buy)
- Practice building models using Rod’s deal analyzer
Short-Term Actions (This Month):
- Underwrite 10-20 deals to build pattern recognition
- Tour properties you’ve underwritten to see how numbers translate to reality
- Join Rod’s Virtual Multifamily Bootcamp to learn advanced techniques
- Build relationships with brokers who can send you off-market deals
Long-Term Development:
- Track your assumptions and compare to actual performance if you buy
- Refine your model based on what you learn
- Specialize in a market so you develop deep expertise
- Consider Rod’s Warrior Program for unlimited deal analysis and mentorship
(Learn more about Rod’s coaching and training programs.)
The Reality About Underwriting: It’s a Skill, Not a Secret
Here’s what I want you to understand: there’s no secret formula that makes you a great underwriter overnight. It’s a skill you develop through repetition.
The first deal you underwrite will take you 4-6 hours. The hundredth deal will take you 30 minutes. You’ll develop instincts about what “good” looks like. You’ll spot red flags instantly that would have fooled you as a beginner.
But you have to start. You have to be willing to underwrite deals knowing you’ll probably pass on them. You have to build the reps.
80-90% of your success in multifamily investing is mindset and taking action. Only 10-20% is the technical knowledge. (Learn more about Rod’s mindset training and courses.)
The technical knowledge—the underwriting, the formulas, the spreadsheets—that’s the easy part. Anyone can learn it.
The hard part is having the discipline to:
- Walk away from deals that don’t meet your criteria
- Stick to conservative assumptions when sellers pressure you
- Stay patient while other investors overpay
- Trust your analysis over your emotions
But when you master that discipline, combined with solid underwriting skills, you become unstoppable.
Frequently Asked Questions About Mutifamily Underwriting
Q: How long does it take to underwrite a multifamily deal?
A: For experienced investors, initial screening takes 15-30 minutes. A full comprehensive underwrite with sensitivity analysis takes 2-4 hours. As you build experience, you’ll get faster at identifying deals that don’t merit deep analysis.
Q: What’s the most important metric in multifamily underwriting?
A: There’s no single “most important” metric, but if I had to choose, it would be NOI—because it drives both property value and your ability to service debt. However, you need to analyze NOI, cap rate, cash-on-cash return, DSCR, and IRR together to understand the full picture.
Q: Should I trust the seller’s pro forma or build my own?
A: Always build your own. The seller’s pro forma is a sales document designed to make the property look as attractive as possible. Use the seller’s T-12 statement as your starting point and verify every assumption independently. Your underwriting should be conservative; theirs will be aggressive.
Q: What expense ratio should I use for multifamily underwriting?
A: It depends on property class and age. Class A properties typically run 35-45%, Class B properties 40-50%, and Class C properties 45-55%+. Always compare your estimated expense ratio to actual historical performance and market comps. If the seller shows expenses significantly below market norms, they’re underestimating.
Q: How do I determine the right cap rate for a property?
A: Research recent sales of similar properties in the same submarket through brokers, CoStar, or public records. Cap rates vary by market, property class, and risk profile. Don’t rely on national averages—use local market data. When in doubt, use a higher (more conservative) cap rate to determine value.
Q: What’s the difference between cash-on-cash return and IRR?
A: Cash-on-cash return measures first-year cash flow as a percentage of your initial cash investment. IRR (Internal Rate of Return) accounts for the time value of money and includes cash flow, profit at sale, and the timing of all cash flows over your hold period. IRR gives you a more complete picture of total returns, while cash-on-cash shows immediate yield.
Q: How much should I budget for capital expenditures (CapEx)?
A: Budget $200-500 per unit per year depending on property age and condition. Newer Class A properties might be at the lower end; older Class C properties at the higher end. Always get a physical inspection and create a 10-year CapEx plan for major systems (roof, HVAC, parking lot, etc.). CapEx is often the line item that kills deals when ignored.
About Rod Khleif
Rod Khleif is one of the nation’s top multifamily real estate experts, best-selling author of “How to Create Lifetime Cash Flow Through Multifamily Properties,” and host of the “Lifetime Cash Flow Through Real Estate Investing” podcast. Over his 40+ year career, Rod has personally owned and managed over 2,000 rental properties and apartment buildings.
Rod’s Warrior Program students collectively own over 260,000 apartment units, and his mission is to help investors create lifetime cash flow through conservative, disciplined multifamily investing.
Ready to master multifamily underwriting?
- Download the Complete Underwriting Checklist (PDF)
- Access Rod’s Free Multifamily Deal Analyzer
- Register for Rod’s Virtual Multifamily Bootcamp
- Text PARTNER to 72345 or email Partner@RodKhleif.com to learn about investing opportunities
Disclaimer: This article was written with the help of AI and reviewed by Rod and his team.
