Cap rates are everything when I’m analyzing multifamily deals. I’ve looked at thousands of properties, and the cap rate instantly tells me if a deal deserves my time or my money. Here’s what most people get wrong: they chase whatever cap rate they see without understanding that good cap rates vary dramatically by market, asset class, and property condition. In 2026, a 5% cap rate might be exceptional in one market but laughable in another. Let me show you how to benchmark yours against comparable properties so you’re actually buying deals, not just hearing good stories. -Rod Khleif
If you’ve been searching for a simple answer to what is a good cap rate for multifamily, here it is: it depends. But not in a way that lets you off the hook but in a way that should make you sharper.
Cap rates vary by city, by property class, by market cycle, and by your own investment goals. And in 2026, cap rates have leveled off near 5% nationwide after years of decline. Knowing the difference between a good cap rate and the right one gives you an edge. It separates smart investors from those who overpay.
This article goes deeper than the basics. You’ll find current multifamily cap rates by city. You’ll see what banks are actually lending on. You’ll learn how cap rates differ across Class A, B, and C properties. At the end, you’ll get answers to the most common questions investors search on Google each day.
What Is a Cap Rate in Multifamily Real Estate?
A capitalization rate, or cap rate, is the ratio of a property’s Net Operating Income (NOI) to its price.
Formula: Cap Rate = NOI ÷ Purchase Price
If a 20-unit apartment building generates $120,000 in NOI and is listed at $2,000,000, its cap rate is 6%.
If you want some help calculating, check out our free instant commercial real estate cap rate calculator.

Cap rate is a pre-financing metric. It ignores your mortgage. It measures the property’s raw return assuming an all-cash purchase. That is why it helps compare deals across markets, asset classes, and financing scenarios.
Think of it as a property’s yield. Just as a bond might return 4.5% annually, a multifamily property at a 6% cap rate delivers 6 cents of income for every dollar of value. The higher the cap rate, the faster you recoup your investment — but the more risk you’re typically accepting.
What Is a Good Cap Rate for Multifamily Properties in 2026?
For most investors in 2026, a good cap rate for multifamily falls somewhere between 4.5% and 8%, depending on market and strategy. Here’s how to think about it:
- 4%–5.5%: Core primary markets (NYC, LA, Boston, Miami). Lower risk, lower return. Investors bank on appreciation and stability.
- 5.5%–7%: Secondary markets and B-class assets. The sweet spot for many experienced multifamily investors balancing cash flow with manageable risk.
- 7%–9%+: Tertiary markets, C-class, or value-add plays. Higher yields, but also more operational complexity, deferred maintenance, and exit risk.
There is no universal “good” cap rate. A 5% cap rate in downtown Miami might be excellent. A 5% cap rate in rural Ohio is a red flag. Context is everything.
Rod’s Rule of Thumb: A good cap rate is one that supports your debt, aligns with your business plan, and lets you sleep at night. If you’re buying on a cap rate that only works in the best-case scenario, you’re not investing — you’re gambling.
Do you want to learn more about Cap Rates? Check out our article: How Cap Rates Work (With Examples)
Average Multifamily Cap Rates by City (2026 Data)
Cap rates vary dramatically across the country. Below is a current snapshot based on data from CBRE, Yardi Matrix, and LoopNet through early 2026.
|
City |
Avg. Multifamily Cap Rate |
Notes |
|
San Francisco, CA |
~3.9%–4.5% |
Most compressed in U.S. |
|
New York City, NY |
~4.5%–5.25% |
Regulatory environment a factor |
|
Los Angeles, CA |
~4.5%–5.0% |
Strong demand, tight supply |
|
Miami, FL |
~4.8%–5.5% |
Sun Belt demand driver |
|
Denver, CO |
~5.0%–5.8% |
Strong fundamentals |
|
Phoenix, AZ |
~5.5%–6.5% |
High transaction volume |
|
Houston, TX |
~6.0%–7.0% |
High returns, oversupply risk |
|
Baltimore, MD |
~8.5%–9.0% |
High yield, value market |
|
Detroit, MI |
~10%–11.5% |
Highest yield, higher risk |
Sources: CBRE U.S. Cap Rate Survey H2 2025; Yardi Matrix; LoopNet 2026 Multifamily Analysis; CRE Daily. Ranges reflect going-in cap rates for stabilized assets.
Key 2026 insight: Multiple industry reports say the national average multifamily cap rate is near 5.04%. It has stayed there for several quarters. This is the longest plateau in 25 years. Analysts broadly expect gradual downward pressure on cap rates through 2026 as credit conditions ease and renter demand stays strong.
Multifamily Cap Rates by Property Class
Property class is one of the most important factors in determining cap rates. Here’s what you need to know about each tier:
Class A: Lowest Cap Rates, Lowest Risk
Class A properties are newer builds (typically under 15 years old) in prime locations, with high-end amenities and creditworthy tenants. Institutional investors compete aggressively for these assets, compressing yields.
- Typical cap rates in primary markets: 4.0%–5.0%
- Typical cap rates in secondary markets: 5.0%–6.0%
- Best for: Investors prioritizing capital preservation and appreciation over current cash flow.
Class B: The Investor Sweet Spot
Class B properties are 15–25 years old, in stable middle-income neighborhoods, and often offer value-add potential through modest renovations and operational improvements.
- Typical cap rates in primary markets: 5.0%–6.5%
- Typical cap rates in secondary/tertiary markets: 6.5%–8.0%
- Best for: Experienced investors seeking a balance of cash flow, upside potential, and manageable risk.
Class C: Highest Cap Rates, Most Complexity
Class C properties are older (25+ years), often in transitional neighborhoods, with deferred maintenance and workforce housing tenants. The higher cap rates compensate for greater operational demands.
- Typical cap rates: 7.5%–11%+
- Best for: Operators with deep property management experience, strong local teams, and capital reserves for CapEx.
Cap Rates by Market and Asset Type
|
Market Type |
Property Class |
Cap Rate Range (2026) |
Risk Level |
|
Primary Metro (NYC, LA, Boston) |
Class A |
4.0%–5.0% |
Low |
|
Primary Metro |
Class B |
5.0%–6.5% |
Low–Medium |
|
Secondary Market |
Class A |
5.5%–6.5% |
Medium |
|
Secondary Market |
Class B/C |
6.5%–8.0% |
Medium |
|
Tertiary / Emerging |
Class B/C |
7.5%–9.5% |
Medium–High |
|
Value-Add / Distressed |
C / D |
8.0%–11%+ |
High |
What Cap Rate Will Banks Lend On for Multifamily?
This is one of the most important, and most overlooked questions in multifamily underwriting. Your cap rate doesn’t just determine value. It determines whether a bank will even lend on the deal.
The Debt Service Coverage Ratio (DSCR) Connection
Lenders use DSCR — the ratio of NOI to annual debt service — as the primary credit metric for multifamily loans. Most banks require a minimum DSCR of 1.20x to 1.25x.
Example: A property with a $150,000 NOI needs at least $120,000 to $125,000 left. This is after paying the annual mortgage. This meets most lenders’ requirements.
How Cap Rate Affects Loan Sizing
At today’s interest rates, standard multifamily loans cost about 5.5%–7%. The exact rate depends on the loan term and the LTV. If the cap rate is under 5%, it can lead to negative leverage. This means the debt cost is higher than the property’s cap rate. This is not automatically a dealbreaker, but it requires a compelling appreciation or rent-growth thesis.
As a general rule in 2026:
- Cap rate at or above the interest rate: Positive leverage. Most banks will lend comfortably.
- Cap rate below the interest rate: Negative leverage. Deal may still work with strong rent upside, but lenders will scrutinize aggressively.
- Cap rate below 4.5% in a rising-rate environment: Banks may require additional reserves, lower LTV, or recourse.
Agency vs. Bank Lending Standards
Fannie Mae and Freddie Mac (agency lenders) typically allow LTVs up to 75%-80% for stabilized multifamily assets and are generally more flexible than commercial banks. They underwrite using stabilized NOI. So if you buy a value-add deal at 5% occupancy today, they underwrite your pro forma. They will review it closely.
For most standard deals in 2026, expect banks to lend conservatively. Plan on 70%-75% LTV, at least 1.25x DSCR, and a rate stress test. The stress test is typically 1%–2% above current rates.
Best Cap Rate Multifamily Markets in 2026: Where Are Investors Finding Yield?
With primary market yields now around 4% to 5%, income investors are looking to secondary and emerging markets. They want stronger cash-on-cash returns.
Highest Cap Rate Markets (Best for Cash Flow)
- Detroit, MI: Cap rates reaching 11%+ for multifamily. High yield, but requires deep local expertise and strong management.
- Baltimore, MD: Averaging 8.5%–9%. One of the most attractive risk-adjusted yield markets in the Mid-Atlantic.
- Tulsa, OK / Jacksonville, FL: Cap rates in the 8.2%–8.9% range with improving economic fundamentals.
- Chicago, IL: Suburban submarkets offer 8%+ in select areas despite the broader regulatory environment.
Balanced Markets (Cash Flow + Appreciation)
- Tampa, FL / Orlando, FL: Solid 6.5%-7% cap rates with continued migration and job growth.
- San Antonio, TX: Strong affordability and cap rates around 6%-7%, with continued population growth.
- Denver, CO: Class A deals in the 5%-5.8% range with a strong long-term outlook.
- Las Vegas, NV: Favorable tax environment, above-average cap rates for a Western market.
Appreciation-Driven Markets (Lower Cap Rates, Long-Term Upside)
- Miami, FL and Fort Lauderdale, FL: 4.8%-6.3% cap rates, driven by ongoing migration and supply constraints.
- Seattle, WA: Q3 2025 saw 7.9% total returns despite compressed going-in cap rates — a function of rent growth.
- San Jose, CA: Among the top performers in Q3 2025 total returns despite sub-5% cap rates.
What Factors Affect Multifamily Cap Rates?
Cap rates don’t exist in a vacuum. Seven key factors drive where any given property prices:
- Location and submarket fundamentals. Job growth, population trends, and local supply constraints all directly impact investor demand — and thus cap rates.
- Interest rates and the cost of capital. When borrowing costs rise, investors demand higher yields to maintain returns, pushing cap rates up. The inverse is also true.
- Property class (A, B, C). As covered above, newer and better-maintained assets command lower cap rates from risk-averse buyers.
- Occupancy and NOI stability. Stabilized, fully occupied properties with consistent rent rolls trade at lower cap rates than value-add or distressed assets.
- Tenant quality and lease structure. Properties with long-term leases, lower turnover, and higher-income tenants compress cap rates.
- Local supply and demand dynamics. Markets like Austin saw cap rates rise in 2024–2025 as oversupply hit — a cautionary tale for investors ignoring pipeline data.
- Investor competition and capital availability. Institutional capital chasing limited inventory drives cap rate compression. When institutions pull back, rates rise.
Cap Rate Trends Heading Into 2026: What to Know
Here’s where the market stands as of early 2026, based on current data from CBRE, Newmark, and JPMorgan Chase:
- National average multifamily cap rate: approximately 5.04%, having held flat since late 2023.
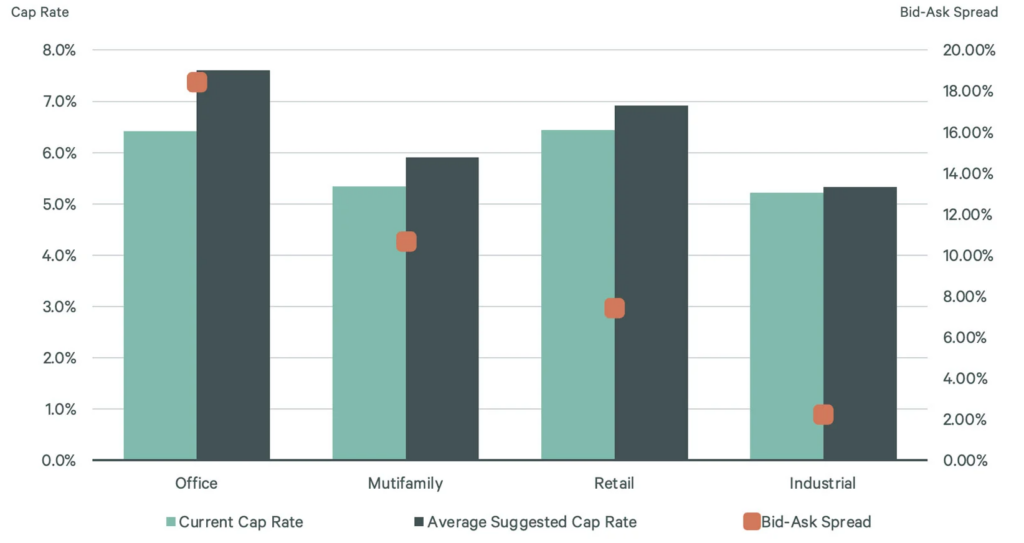
- Going-in vs. exit cap spread: CBRE data shows average going-in rates near 4.75% with exit caps near 4.96% — a 21 bps spread that signals investors are pricing in modest appreciation.
- Direction in 2026: Most analysts expect cap rates to gradually compress as the Fed continues rate cuts and credit conditions ease. Private investors remain the dominant buyers; REIT participation is growing.
- Best-performing markets by total return in 2025 (Q3): San Jose (9%+), Houston (9%), Miami (8.4%), Seattle (7.9%).
- Markets to watch for oversupply risk: Austin, TX and Raleigh, NC posted below-average returns due to new supply absorption challenges.
The bottom line: Investors who can lock in today’s cap rates in markets with improving fundamentals may be positioned well as values rise in 2026 and beyond.
How to Calculate Cap Rate on a Multifamily Deal
Calculating cap rate isn’t complicated — getting the inputs right is.
Step 1: Determine Gross Potential Income (GPI)
Add up total potential rent across all units at market rates, assuming 100% occupancy.
Step 2: Subtract Vacancy and Credit Loss
Apply a realistic vacancy factor; typically 5%–10% depending on the market. In hot markets you might underwrite 5%; in tertiary markets, 8%–10% is more prudent.
Step 3: Calculate Effective Gross Income (EGI)
GPI minus vacancy and credit loss. Add any ancillary income (laundry, parking, pet fees).
Step 4: Subtract All Operating Expenses
This includes: property taxes, insurance, property management (always include this even if self-managing — use 6%–8% of EGI), maintenance and repairs, utilities, landscaping, advertising, and reserves for replacement (typically $300–$500 per unit per year).
Do NOT subtract mortgage payments. Cap rate is a pre-financing metric.
Step 5: Divide NOI by Purchase Price
Cap Rate = NOI ÷ Purchase Price
Example: $180,000 NOI ÷ $3,000,000 purchase price = 6.0% cap rate
Pro Tip: Never rely on the seller’s pro forma for NOI. Verify using trailing 12-month actuals, real expense reports, and your own independent management cost estimate.
Final Thoughts: Cap Rate Is a Tool, Not the Answer
Cap rates give you a fast read on a deal’s income potential. But they don’t tell you the full story.
A 7% cap rate in a declining market with poor schools, job losses, and no rent growth potential is a bad deal. A 5% cap rate in a supply-constrained, high-growth submarket with institutional-quality tenants and strong rent upside may be an excellent deal.
The investors who succeed in multifamily understand what drives the cap rate, and whether those fundamentals support the price. They look at cash-on-cash return, IRR, debt coverage, and exit strategy in addition to cap rates.
Cap rate is the starting point. Due diligence is the finish line.
Use the free Cap Rate Calculator at rodkhleif.com to run numbers on any deal instantly, and always underwrite conservatively.
FAQ: Multifamily Cap Rates: Your Top Questions Answered
What is a good cap rate for multifamily property in 2026?
A good multifamily cap rate in 2026 generally falls between 5% and 8% for most investors. In primary markets like New York or Los Angeles, 4.5%-5.5% is considered solid. In secondary and tertiary markets, 6%-9% is more typical. The “right” cap rate depends on your market, property class, financing structure, and investment goals.
What is the average cap rate for multifamily properties right now?
As of early 2026, the national average multifamily cap rate is approximately 5.0%–5.1%, according to Yardi Matrix data covering the top 30 U.S. markets. This has remained largely flat since mid-2023, following a significant rise from the 2021 historic low of 4.1%.
What cap rate will banks lend on for multifamily?
Most conventional and agency lenders (Fannie Mae/Freddie Mac) require a minimum DSCR of 1.20x to 1.25x. At current interest rates of roughly 5.5%-7%, a cap rate at or above the interest rate provides positive leverage and the strongest loan terms. Cap rates below 5% may still qualify, but lenders will scrutinize NOI assumptions more aggressively and may require lower LTV.
What are multifamily cap rates by city?
Cap rates vary significantly by city. San Francisco and Manhattan typically see the most compressed rates (3.9%-5%), while markets like Detroit (10%–11.5%), Baltimore (8.5%–9%), and Tulsa (8%–9%) offer much higher yields. Miami, Denver, Tampa, and Phoenix fall in the middle, ranging from 5% to 6.5%, and are favored by investors seeking a balance of cash flow and appreciation.
What is the best cap rate for multifamily properties?
There is no single best cap rate, it depends entirely on your strategy. Yield-focused investors targeting cash flow might seek 7%+ cap rates in secondary markets. Appreciation-focused investors in primary markets may accept 4.5%–5.5%. The best cap rate is one that supports your debt, aligns with your exit strategy, and appropriately prices the risk of the specific market and asset.
How do cap rates differ between Class A, B, and C multifamily?
Class A properties typically trade at 4%-5.5% cap rates, Class B at 5.5%-8%, and Class C at 7.5%-11%+. The spread reflects the additional risk, operational complexity, and CapEx requirements associated with older, lower-amenity properties. Many experienced investors favor Class B for its balance of yield and manageable risk.
Are multifamily cap rates going up or down in 2026?
After holding near 5% for about seven quarters, multifamily cap rates had their longest plateau in 25 years. Most analysts expect these cap rates to decline slowly in 2026. Drivers include improving credit conditions, anticipated Fed rate cuts, and sustained renter demand. However, oversupplied markets like Austin may see rates hold steady or rise slightly as the market absorbs new inventory.
What is the cap rate formula for multifamily?
Cap Rate = Net Operating Income (NOI) ÷ Purchase Price. NOI is total revenue minus all operating expenses, excluding debt service and capital expenditures. For example, a property with $200,000 NOI purchased for $3,500,000 has a cap rate of approximately 5.7%.
How do I find cap rates for multifamily properties in my market?
The most reliable sources for current multifamily cap rates by city include CBRE’s bi-annual U.S. Cap Rate Survey, Yardi Matrix, CoStar, and LoopNet market reports. Local commercial brokers and lenders who specialize in multifamily are also excellent sources of real-time market cap rates specific to your submarket and asset class.
Can I use cap rate to compare multifamily properties in different cities?
Yes, cap rate is specifically designed for cross-market comparison. A 6% cap rate in Dallas and a 6% cap rate in Cincinnati represent different risk profiles, rent growth prospects, and liquidity conditions. Always pair cap rate with local market fundamentals: job growth, population trends, supply pipeline, and historical rent growth.
Ready to Invest in Multifamily Real Estate?
Understanding cap rates is step one. Building the deal flow, due diligence skills, and investor network to act on great opportunities is where the real work begins.
- Join the next Multifamily Bootcamp
- Download Rod’s FREE Best-Selling Multifamily Book
- Use the Free Cap Rate Calculator
- Apply for the Warrior Mentorship Program
Disclaimer: This article was written with the help of AI and reviewed by Rod and his team.
