
Houston is one of the most watched markets in American commercial real estate, and for good reason. It leads the country in population growth, it is steadily diversifying beyond oil, and it offers something investors in tighter coastal markets rarely find: room to grow. But Houston is not one market. It is dozens of submarkets and four very different asset classes, each moving on its own cycle. This analysis breaks down where Houston commercial real estate actually stands in 2026, asset class by asset class, so you can invest on current numbers instead of an old reputation.
As of mid-2026, Houston is a tale of four asset classes. Industrial and retail are healthy, with low vacancy and positive rent growth. Multifamily is digesting a wave of new supply and setting up for recovery. Office is split between tight, high-quality space and a struggling older inventory. Underneath all of it sits the strongest population and job growth of any major U.S. metro.
What is in this analysis
- The Houston economy: the engine behind every asset class
- Multifamily: digesting supply, setting up for recovery
- Industrial: the standout performer
- Office: a flight-to-quality story
- Retail: quietly healthy
- Houston cap rates by asset class
- How to read a Houston submarket: the Submarket Scorecard
- Risks and what to watch
- Frequently asked questions
- Ready to take the next step?
The Houston economy: the engine behind every asset class
Real estate follows people and jobs, and Houston has more of both than almost anywhere. The metro added just under 127,000 residents last year, the most of any U.S. metro, and the Greater Houston Partnership forecasts about 30,900 new jobs in 2026 on the way to a record 3.5 million total. That demand is the foundation under every asset class here.
The 2026 job forecast is moderate by Houston standards, below the roughly 50,000 a year the region averaged recently, which reflects a cooler national economy. What matters for investors is the mix. Health care and social assistance are projected to drive nearly half of the new jobs, around 14,000, followed by construction, public education, and professional and technical services, all tied to serving a growing population. Meanwhile, sectors tied to upstream oil, including extraction and some manufacturing, are expected to contract if oil prices soften. Houston is far more diversified than it was a decade ago, but energy still moves the needle, and that is the single biggest thing that makes Houston different from a Sun Belt peer like Dallas or Phoenix. You can read the region’s own numbers at the Greater Houston Partnership.
Multifamily: digesting supply, setting up for recovery
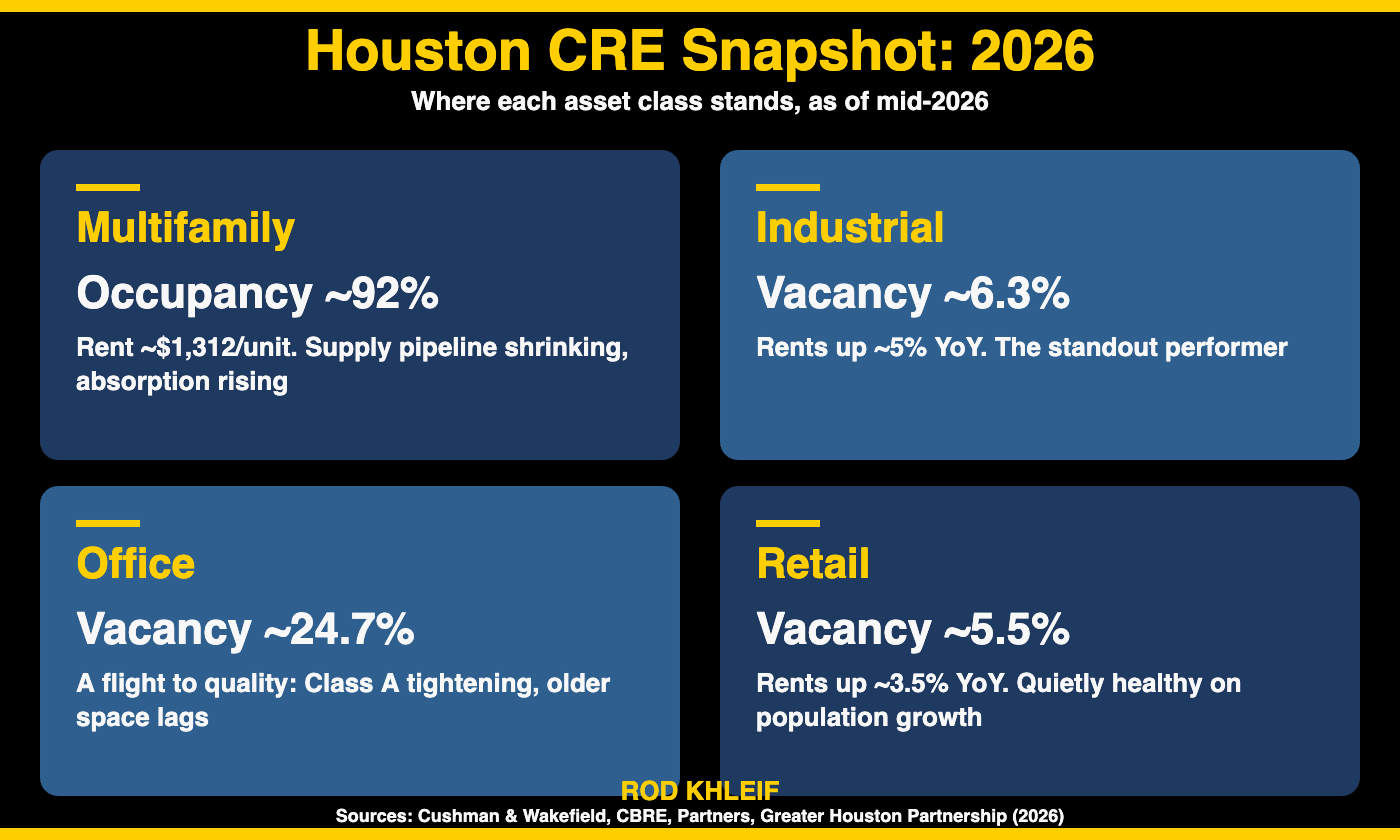
Houston multifamily is in the part of the cycle that scares beginners and excites disciplined buyers. A heavy wave of new deliveries pushed occupancy to around 92 percent and held effective rents near $1,312 a unit, roughly flat to slightly down over the past year as operators chose occupancy over pushing rate. On the surface, that reads as a soft market.
Look closer and the setup is turning. Net absorption jumped to about 6,177 units in the second quarter of 2026, nearly triple the prior quarter, so demand is clearly there. At the same time the supply that caused the softness is drying up fast: the construction pipeline fell to roughly 11,756 units underway, down about 21 percent, and completions in 2026 are forecast to drop toward the lowest level in over a decade. That is the classic late-supply-cycle pattern, soft rents today while the pipeline empties, then a tighter market as demand catches up. A few submarkets are already positive, including the East End, South Central, and Northeast Houston. For investors, the move is to underwrite to flat near-term rents, protect net operating income through operations, and let the shrinking pipeline do the heavy lifting. Current figures come from the Cushman & Wakefield Houston MarketBeat.
Industrial: the standout performer
If multifamily is the recovery story, industrial is the steady one. Overall vacancy sat around 6.3 percent in mid-2026, a healthy level, while average asking rents climbed to about $7.87 per square foot, up roughly 5 percent year over year. The warehouse and distribution segment, the largest slice of the market, ran near $7.67 and still posted positive rent growth even as new buildings kept delivering.
That combination, low vacancy and rising rents while supply is still coming online, tells you demand is real. It is powered by the Port of Houston, a fast-growing population, and consumers who need goods moved and stored. The South, West, and Southwest submarkets command the highest rents. Cushman & Wakefield has noted that peak industrial vacancy is likely in the rearview mirror as demand holds and new supply slows. For investors, industrial is the most durable Houston play, though the steady stream of new product keeps rent growth reasonable rather than explosive, which is exactly what you want if you are underwriting conservatively.
Office: a flight-to-quality story
Office is where the headlines and the opportunities diverge. Overall vacancy was about 24.7 percent in the second quarter of 2026, high by any standard, but that single number hides a split market. Class A space ran near 23.9 percent vacancy while older Class B sat closer to 28.7 percent, and the healthy activity is concentrated at the top. Leasing rose sharply to open the year, Class A captured essentially all of the positive absorption, and the best Tier 1 and trophy space has grown scarce enough to push record rents, with the overall average gross asking rent near $32 a square foot. New construction is muted.
Read that as a barbell, not a broad recovery. Well located, high-quality buildings are tightening and pricing power is returning at the very top. Commodity Class B, especially in energy-exposed submarkets, is where the vacancy, the distress, and the eventual value-add or conversion plays live. Office is the highest-risk, highest-selectivity asset class in Houston right now, and it is not a place for a first deal.
Retail: quietly healthy
Retail is the asset class investors underrate in Houston. Vacancy was around 5.5 percent in early 2026, and average asking rents rose to about $21.28 per square foot on a triple-net basis, up roughly 3.5 percent year over year. Net absorption stayed positive and supply and demand are close to balanced, helped by years of building discipline that kept the market from overbuilding the way it did before 2008. The Inner Loop commands the highest rents, near $32 a square foot.
The engine here is simple: population growth means rooftops, and rooftops mean retail demand. Necessity and grocery-anchored centers in particular have held up well. For an investor who wants cash flow and less headline drama than office, well-located Houston retail deserves a serious look.
Houston cap rates by asset class
Cap rates are where the market prices all of this. The figures below are approximate 2026 ranges drawn from CBRE and Marcus & Millichap, and they move with quality, location, and the specific deal, so treat them as directional rather than precise.
| Asset class | Approx. 2026 cap rate | Trend and note |
|---|---|---|
| Multifamily | ~5.5% to 6% | Roughly flat early in 2026, expected to compress as the supply pipeline shrinks |
| Industrial | ~7% to 7.5% | Edged down from late 2025 as sales activity improved |
| Retail | ~6.4% to 6.8% | Large centers near 6.55%, strip near 6.44%, single-tenant net lease near 6.80% |
| Office | Wide and deal-specific | Steep dispersion, with distressed pricing on older Class B assets |
If you want a refresher on how to read these numbers, see our guide on what counts as a good cap rate for multifamily. The rule for every asset class is the same: the cap rate only matters relative to your cost of capital and the rent growth you can realistically underwrite.
How to read a Houston submarket: the Submarket Scorecard
Houston rewards investors who go one level deeper than the metro numbers. A deal in the Texas Medical Center orbit, the Energy Corridor, the port submarkets, and a suburban growth ring can behave completely differently. I score every submarket on the same five factors, and I call it the Submarket Scorecard.
- Demand engine. What actually drives jobs and rooftops here? A medical center, the port, a distribution hub, and a master-planned growth corridor are durable. A single energy tenant is not.
- Supply pipeline. What is under construction versus what the market is absorbing? New supply is the number one thing that softens rents in the short run.
- Rent trajectory. Direction beats level. A submarket with modest rents and positive momentum can beat a pricey one that has peaked.
- Cap rate versus your cost of capital. The yield only matters next to your debt. If the cap rate does not clear your borrowing cost with room to spare, the deal does not work no matter how good the story sounds.
- Local risk. Flood zone, insurance cost, property taxes, and energy exposure vary block by block in Houston. Price them in before you fall in love with a building.
Risks and what to watch
Houston is a strong market, not a riskless one. Three things belong on every investor’s radar here. First, energy. The region is more diversified than it used to be, but oil prices still move office demand and a slice of the job base, so a sharp downturn would be felt. Second, insurance and taxes. Houston carries some of the highest property insurance costs in the country along with meaningful property taxes and real flood exposure, and those line items can quietly sink a pro forma. Underwrite them hard, and read our guide on multifamily insurance before you close. Third, supply. Multifamily and retail pipelines are still adding product, so do not assume instant rent growth in any submarket.
Rod Khleif: “Houston will reward you if you respect it. The people and jobs are the best in the country, but the energy tilt, the insurance, and the supply cycle punish anyone who buys the reputation instead of the current numbers. Do the work, submarket by submarket, and Houston is one of the great long-term markets in America.”
Frequently asked questions
Is Houston a good market for commercial real estate in 2026?
For long-term investors, yes, with discipline. Houston leads the nation in population growth and is adding jobs even as the national economy cools, which supports demand across every asset class. The catch is that the market is diverse, so returns depend heavily on picking the right asset class and submarket.
Which Houston asset class is performing best in 2026?
Industrial and retail are the healthiest, with low vacancy and positive rent growth. Multifamily is recovering as new supply slows. Office is the weakest overall, though top-tier Class A space is tightening.
What are Houston cap rates in 2026?
As approximate ranges, multifamily runs about 5.5 to 6 percent, industrial about 7 to 7.5 percent, and retail about 6.4 to 6.8 percent, with office highly deal-specific. Cap rates vary widely by quality and location, so treat these as directional.
Why is Houston office vacancy so high?
Overall office vacancy is near 25 percent because of years of energy-sector consolidation and hybrid work, which hit older Class B space hardest. High-quality Class A and trophy buildings are actually tightening, so the market is split rather than uniformly weak.
Is Houston multifamily a good investment right now?
It can be for patient buyers. Rents are soft today after heavy deliveries, but absorption is rising and the construction pipeline is shrinking fast, which historically precedes a tighter, stronger market. Underwrite to flat near-term rents and buy for the recovery.
Ready to take the next step?
A market analysis is only useful if you can turn it into a deal. New to commercial real estate? Start with the complete beginner guide to multifamily investing, then grab the free Lifetime CashFlow ebook and join my Multifamily Bootcamp, where I teach investors how to analyze markets and close deals in places exactly like Houston.
This article is for educational purposes only and is not investment, financial, or tax advice. All figures are approximate, drawn from third-party market reports current as of mid-2026, and change frequently. Verify current data and your own numbers with qualified professionals before investing. Sources include the Greater Houston Partnership, Cushman & Wakefield, CBRE, Partners, Marcus & Millichap, and JLL.
