
I first wrote this post in December 2024, after my CREE acquisition team lost a San Antonio deal at $14 million to a full price offer at the $17 million whisper. I am rewriting it in October 2026 because the market has done exactly what we said it would do, just slower and with more pain in the middle. Construction starts have collapsed, the Fed just raised rates, and the question I get from Warriors every week is whether San Antonio apartment demand is really outstripping supply or whether that is broker talk. This post answers it with the numbers and the underwriting, and the original deal story is still here near the end.
- Is San Antonio Apartment Demand Really Outstripping Supply in 2026?
- The Supply Cliff Scorecard
- Where Are San Antonio Rents and Occupancy Heading?
- How Do You Underwrite a San Antonio Deal in Late 2026?
- 2024 Assumptions vs 2026 Underwriting
- Chasing Rent Growth vs Buying the Supply Cliff
- What We Learned on the $17 Million Deal
- San Antonio Apartment Demand FAQ
- Ready to Take the Next Step?
Is San Antonio Apartment Demand Really Outstripping Supply in 2026?
Yes, on the numbers that matter for the next three years. Newmark’s second quarter 2026 report shows San Antonio absorbed 5,610 units year to date against 3,726 delivered, construction starts are down 95 percent from the 2022 peak, and nothing broke ground in 2026. Rents are still soft because 2024’s record deliveries are being digested, which is exactly why the buying window is open now.
Two things are true at the same time, and investors who only hear one of them get the market wrong. San Antonio delivered close to 14,000 units at the late 2024 peak, inventory grew 20 percent in five years, and that pushed vacancy into double digits and rents negative. That is the headline. The second truth is that the pipeline behind those deliveries is nearly empty. Northmarq forecasts about 2,600 deliveries for all of 2026, a 63 percent drop and the slowest pace since 2011, with permitting at its lowest in more than a decade. Demand did not go anywhere. The metro added about 38,000 people between July 2024 and July 2025 to reach 2.81 million, and Toyota announced a $3.6 billion expansion with 2,000 jobs in July 2026. When supply stops and demand keeps coming, the gap closes fast. The most affordable rental markets post explains why San Antonio keeps showing up on that list.
Why Two Data Providers Disagree About San Antonio
You will see San Antonio occupancy quoted anywhere from 85 to 93 percent in 2026, and both numbers come from real reports. Here is how to read them before you believe either one.
- RealPage data, used by Newmark, counts stabilized conventional properties and showed 93.1 percent occupancy and $1,218 average asking rent in the second quarter of 2026, with rents returning to annual growth.
- CoStar data, used by Apartments.com and MMG, includes lease-ups and a broader property set and showed vacancy above 15 percent and rents down 3.0 percent year over year in July 2026.
- Yardi Matrix sat between them at 89.8 percent occupancy in February 2026 and $1,232 advertised rent, down 2.8 percent year over year through March.
- The direction is the same in all three: deliveries falling, absorption positive, rents bottoming. The level depends on whether lease-ups are in the denominator.
- Underwrite the specific submarket and vintage you are buying, not the metro average, because a 1990s Class B in North Central behaves nothing like a 2024 lease-up on the far west side.
The Supply Cliff Scorecard
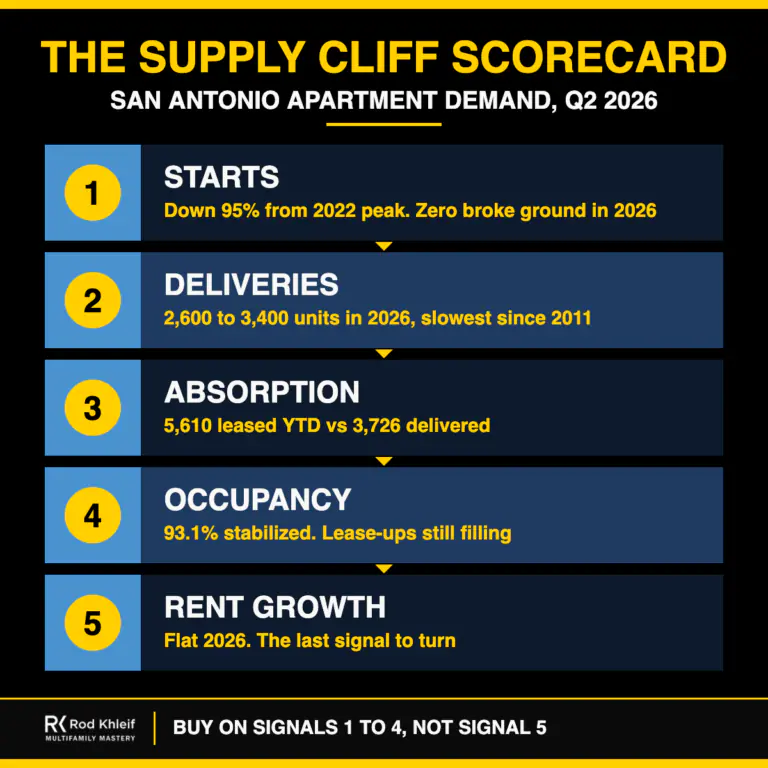
I use five signals to decide whether a market is about to flip from oversupplied to undersupplied, and I score San Antonio on each one below. The framework is simple because the mistake investors make is simple: they wait for the fifth signal, rent growth, before they buy, and by then the price has moved. The first four signals are visible 12 to 24 months earlier, and they are all flashing in San Antonio right now.
Want to score your own target market with me on a live deal? Join the next Multifamily Bootcamp →
Signal 1: Construction Starts
The earliest signal and the one almost nobody tracks. Newmark counted 644 units of starts in the trailing period, down 95 percent from the fourth quarter 2022 peak, and zero units breaking ground in 2026. A start today delivers in 2028, so whatever is not started now cannot compete with your building for at least two years. San Antonio passes this signal with room to spare.
Signal 2: Deliveries
Deliveries lag starts by 18 to 30 months, which is why 2024 and 2025 were painful even as starts fell. Completions ran 6,747 units in 2025 according to CoStar data compiled by MMG, close to the ten-year average of 6,772. The 2026 forecast is 3,364 units from CoStar and 2,600 from Northmarq, both the lowest since 2011. The wave has passed.
Signal 3: Absorption
Absorption is demand measured in leased units. CoStar put 2025 net absorption at 5,415 units, above the ten-year average of 4,808, and forecasts 4,424 for 2026. Newmark’s year-to-date 2026 figure of 5,610 already exceeds deliveries. Either way, the metro is leasing more units than it is building for the first time since 2021, which is the definition of demand outstripping supply.
Signal 4: Occupancy
Occupancy turns after absorption has outrun deliveries for two or three quarters. RealPage shows stabilized occupancy at 93.1 percent already. CoStar, with lease-ups included, forecasts 86.8 percent at year end 2026, essentially flat, because the 2024 deliveries are still filling. Watch the lease-up inventory burn off through 2027. That is when the broader numbers catch up to the stabilized ones.
Signal 5: Rent Growth
The last signal and the one everyone waits for. CoStar has effective rent at $1,219 at the end of 2025 and $1,221 forecast for the end of 2026, a return to slightly positive growth after a 2.9 percent decline. RealPage already shows annual growth. By the time rent growth is obvious in the headlines, probably mid-2027, the sellers who are motivated today will have been bought out. Signals one through four are why you buy before signal five.
If you are new to reading absorption and occupancy data, my free book covers how to turn market signals into an offer price. Click the cover below to download it and keep it open while you work through the underwriting section.

Where Are San Antonio Rents and Occupancy Heading?
The honest answer is flat through the end of 2026 and up from 2027, and the reason is arithmetic, not optimism. Here is the data behind that call, with the sources so you can check it yourself. Newmark’s second quarter 2026 San Antonio snapshot puts total inventory at 248,182 units, deliveries below the five-year average since late 2025, and the average rent-to-income ratio near 20 percent, roughly $550 a month below the 30 percent affordability line. Owning a home in the metro costs about twice what renting does. That is a deep well of renter demand that does not depend on anyone moving to Texas.
Then add the people who are moving. The metro grew by about 38,000 residents in the year to July 2025, a 1.4 percent pace that most coastal markets have not seen in a decade. Toyota’s July 2026 announcement adds a second assembly line, 2.5 million square feet and 2,000 direct jobs on the South Side, with 23 on-site suppliers that will hire behind them. Those are renters for Class B and C product within a 20-minute drive of the plant, which is the product most of my Warriors own.
What holds rents back in the near term is the lease-up overhang from 2024. CoStar still sees vacancy in the mid-teens when those buildings are counted, and concessions on new product keep pressure on everyone within a few miles. That pressure fades as the lease-ups stabilize and nothing replaces them. My expectation, and the way I underwrite it, is flat effective rent in 2026, 2 to 3 percent in 2027, and 3 to 4 percent in 2028 if starts stay near zero. The good cap rate for multifamily guide shows how that growth path translates into value.
How Do You Underwrite a San Antonio Deal in Late 2026?
Here is the deal I would run today, built from the same market data above and the debt costs that exist after the Fed’s September 16, 2026 hike. The 10-year Treasury is above 5 percent and agency quotes for a stabilized Class B asset are near 7 percent. Walk the six steps with the free Deal Analyzer open and plug in your own target.
- Build revenue from the market, not the broker. A 200-unit 1990s Class B community at the RealPage average rent of $1,218 and 93 percent occupancy collects about $2.72 million a year. Use the stabilized number only if the property is stabilized; a lease-up gets the CoStar vacancy.
- Apply a real expense ratio. San Antonio property taxes and insurance push Class B expense ratios to 48 to 52 percent. At 48 percent the net operating income is about $1.41 million.
- Price it three ways. At the December 2024 average of $152,000 a door the price is $30.4 million and the cap rate is 4.65 percent. At the Q1 2026 median of $132,600 a door it is $26.5 million and 5.3 percent. At $110,000 a door, where motivated 2021 buyers with floating debt are starting to trade, it is $22 million and 6.4 percent.
- Size the debt at 7 percent and 1.25 coverage. At 65 percent loan to value and 30-year amortization, coverage is 0.90 at $152,000 a door, 1.03 at $132,600, and 1.24 at $110,000. Only the last one is financeable without a large equity cushion.
- Check cash-on-cash before growth. The $110,000 basis produces about $272,000 of cash flow on $7.7 million of equity, a 3.5 percent going-in yield. The other two are negative or near zero. Growth has to carry them, and growth is not here until 2027.
- Layer the Supply Cliff. On the $110,000 basis, 3 percent rent growth in 2027 and 2028 with flat expenses takes NOI to roughly $1.58 million, coverage to 1.38, and the cash-on-cash yield to about 5.7 percent by year three, before any exit cap compression. That is the trade: buy at today’s basis with today’s debt and let the supply cliff do the work.
Three Entry Points, Same 200 Units
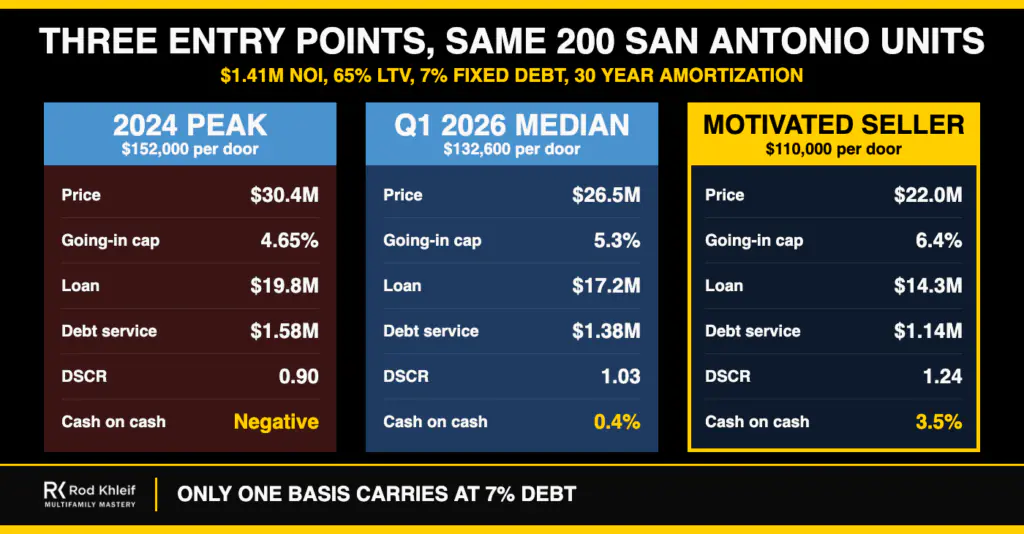
The first column is the buyer who won our deal in December 2024, paying a 2024 basis with a 2024 rate assumption, and in 2026 that buyer has a coverage ratio under 1.0 and a loan maturity coming. The second column is the Q1 2026 median trade at $132,600 a door, which only works with 50 percent leverage or a seller note. The third column is the deal my team is actually sending letters of intent on: a 1990s Class B near the Toyota corridor or North Central at $100,000 to $115,000 a door from a seller who has to recapitalize before a 2027 maturity. It carries from day one, and every point of rent growth the supply cliff delivers goes straight to equity. If you want the full method for finding those sellers, the recession proof portfolio post covers the maturity wall.
2024 Assumptions vs 2026 Underwriting
When we lost the $17 million deal in 2024, we reverse engineered what the winning buyer must have assumed to reach a 15 percent internal rate of return at full price. The left column below is that buyer. The right column is how we underwrite the same building today.
The difference between the two columns is roughly $8 million of price on a 200-unit building. That is not a difference of opinion about San Antonio. Both columns believe in the market. It is a difference about how much of the future you are willing to pay for today, and after the September rate hike, the answer is less.
Chasing Rent Growth vs Buying the Supply Cliff
Investors who buy San Antonio in the next 12 months will fall into one of two groups. The table is how each group behaves, and which one owns the building in 2029.
The second column is not a prediction that San Antonio rents will boom. It is a recognition that when starts are down 95 percent and the metro is still adding 38,000 people a year, the odds are asymmetric, and the way you get paid for asymmetric odds is a basis that works without them. For the complete framework on what a good entry cap rate looks like by class, the fed rate vs cap rates post shows how the September hike reset every number in this table.
What We Learned on the $17 Million Deal
Here is the original story, because it still teaches the lesson. In late 2024 the broker’s whisper price on a San Antonio property was $17 million. My acquisition team reviewed the trailing twelve months, underwrote it with a 5.6 percent exit cap and our 15 percent minimum return, and submitted $14 million. The seller took a full price offer within days. We went back and asked what the winning buyer had to be modeling, and the answer was that even dropping the exit cap to 5.0 percent only pushed our return to 9.7 percent. To reach 15 percent at $17 million, the buyer needed rent growth and exit cap assumptions that the market has not delivered. At the time, transaction volume in San Antonio was down 60 percent year over year and the average price per unit on the deals that did close was $152,000, up 12 percent. Today the median is $132,600 and cap rates have moved from 5.5 percent to 6.0 percent, according to Northmarq’s first quarter 2026 report. The building we did not buy is worth less than we offered.
That is the whole lesson of this market. Being right about demand is not enough. We were right about San Antonio in 2024, and we would have lost money paying $17 million for it. The investors in my program who are winning here now are the ones who held their underwriting through 18 months of being outbid and are now the only serious buyers for sellers who need to transact. You can hear several of them, and the lenders pricing these deals, on the Lifetime Cash Flow podcast.
Rod Khleif: “Demand outstripping supply is not a reason to overpay. It is a reason to buy right and wait. The supply cliff pays the patient buyer, and it punishes the one who paid for 2027 rents in 2024.”
San Antonio Apartment Demand FAQ
Q: Is San Antonio apartment demand outstripping supply in 2026?
A: On stabilized data, yes. Newmark reported 5,610 units absorbed year to date in 2026 against 3,726 delivered, with construction starts down 95 percent from the 2022 peak. Broader data that includes lease-ups still shows elevated vacancy, because 2024’s record deliveries are being absorbed, but the forward pipeline is the thinnest since 2011.
Q: What is the San Antonio apartment vacancy rate in 2026?
A: It depends on the data set. RealPage data from Newmark shows 93.1 percent occupancy on stabilized properties in the second quarter of 2026. CoStar data including lease-ups shows vacancy above 15 percent. Yardi Matrix reported 89.8 percent occupancy in February 2026. Underwrite the specific submarket and vintage rather than the metro average.
Q: Are San Antonio apartment rents going up or down?
A: Flat to slightly down in 2026, turning positive in 2027. CoStar has effective rent at $1,219 at the end of 2025 and $1,221 forecast for the end of 2026 after a 2.9 percent decline, while RealPage shows a return to annual growth. With almost no new supply after 2026, 2 to 4 percent annual growth in 2027 and 2028 is a reasonable underwriting case.
Q: How many apartments are being built in San Antonio in 2026?
A: Very few. Northmarq forecasts about 2,600 deliveries in 2026, a 63 percent drop from 2025 and the slowest year since 2011. CoStar forecasts 3,364. Newmark counted zero units breaking ground in 2026 and starts down 95 percent from the fourth quarter of 2022.
Q: What are San Antonio multifamily cap rates in 2026?
A: Northmarq reported an average cap rate of 6.0 percent in the first quarter of 2026, up from 5.5 percent in 2024, on a median price of $132,600 per unit. With agency debt near 7 percent after the September 2026 Fed hike, deals that carry at 1.25 coverage are trading closer to 6.5 percent, or $100,000 to $115,000 a door for 1990s Class B.
Q: Why did San Antonio rents fall in 2024 and 2025?
A: Supply. The metro delivered close to 14,000 units at the late 2024 peak and inventory grew 20 percent between 2021 and 2026. Demand stayed strong, with 2025 absorption above the ten-year average, but it could not keep pace with deliveries, so concessions rose and effective rents fell about 3 percent.
Q: Is San Antonio a good market for multifamily investing right now?
A: For buyers who underwrite at today’s debt cost and buy from motivated sellers, yes. The combination of a collapsed construction pipeline, steady population growth of about 38,000 a year, the Toyota expansion, and rents roughly $550 a month below the affordability line is the setup that produces rent growth from 2027. The risk is paying 2024 prices for it.
Q: What is the Toyota expansion in San Antonio?
A: In July 2026 Toyota announced a $3.6 billion expansion of its South Side plant, adding a second assembly line for the Tacoma, about 2.5 million square feet, and 2,000 direct jobs, with the local workforce growing to roughly 6,000 by 2030. The plant’s 23 on-site suppliers will hire alongside it, which supports Class B and C rental demand on the South Side.
Q: How does the September 2026 Fed hike affect San Antonio apartment deals?
A: It raised debt costs to about 7 percent for agency loans, which means a 200-unit Class B deal only clears 1.25 coverage at 65 percent leverage if the price is near $110,000 a door and a 6.4 percent cap rate. At the 2024 average of $152,000 a door, coverage falls below 1.0. The hike did not change demand; it changed the price you can pay for it.
Q: Which San Antonio submarkets are best for apartment investors in 2026?
A: North Central was the only submarket with positive rent growth in the first quarter of 2026 per Northmarq, and the South Side corridor around the Toyota plant has the clearest job growth story. Avoid submarkets with heavy 2024 lease-up inventory on the far west and northwest sides until concessions burn off.
Ready to Take the Next Step?
San Antonio is the kind of market where the Multifamily Bootcamp earns its price in one deal. Two live days, real San Antonio and Texas deals, real debt quotes, and the Supply Cliff Scorecard applied in front of you so you know what to pay before the rent growth shows up in the headlines.
Reserve your seat at the next Multifamily Bootcamp →
Want to run a San Antonio deal before then? Download the free Multifamily Deal Analyzer, enter a 7 percent rate, 1.25 coverage and flat 2026 rents, and see what a target property is worth today.
Not ready for a live event yet? Start with the free book. It covers market selection, underwriting and debt from the first chapter.
Download the free book: How to Create Lifetime Cashflow Through Multifamily Properties →
Disclaimer: This article was written with the help of AI and reviewed by Rod and his team. Market figures are drawn from the cited Newmark, Northmarq, CoStar, Yardi Matrix, Census and Toyota sources as of October 2026 and change frequently. The deal example and scenarios are illustrative and do not describe the financial results of any specific property or offering. Nothing here is investment, legal or tax advice.
