
On September 16, 2026 the Federal Reserve raised the fed funds rate for the first time since July 2023, and the 10-year Treasury pushed through 5 percent for the first time since 2007. I have bought apartments through four rate cycles, and the question I am getting from Warriors every day is the same one: what does the fed rate vs cap rates relationship mean for the deal I am underwriting right now? This post answers it with the numbers as they stand in October 2026. If you want to run your own property against them as you read, open the free cap rate calculator in a second tab.
- What Did the Fed Do on September 16, 2026?
- How Does the Fed Rate Reach Your Cap Rate?
- Where Are Multifamily Cap Rates by Class After the Hike?
- What Happens to a 5.5% Cap Deal When Debt Costs 7%?
- How Should You Underwrite Each Class Now?
- Reactive Investor vs Rate Ladder Investor
- What I Am Doing With My Own Portfolio
- Fed Rate vs Cap Rates FAQ
- Ready to Take the Next Step?
What Did the Fed Do on September 16, 2026?
The Fed raised the federal funds target range 25 basis points to 3.75 to 4.00 percent on September 16, 2026, by a 12 to 0 vote, the first hike since July 2023. The 10-year Treasury, which prices most multifamily debt, climbed above 5 percent, so borrowing costs now sit above most stabilized cap rates. That is negative leverage, and it changes what every apartment deal is worth.
The statement itself was short. The Committee said inflation “remains elevated” and that the hike would support a “timelier return” to its 2 percent goal. August CPI printed 3.4 percent year over year and core PCE 3.0 percent, so this was not a surprise to the bond market, which had already pushed the 10-year to an intraday 5.04 percent the day before the meeting. What matters more for you is the projection: the median policymaker now pencils in a 4.1 percent fed funds rate by year end, which means one more hike is on the table, and 16 of the 18 participants expect it. You can read the FOMC statement yourself. It is two pages.
Here is the part most investors skip. The fed funds rate is an overnight rate between banks. Your apartment loan is priced off the 10-year Treasury plus a lender spread, and the 10-year had already moved from 4.67 percent in May to 5.22 percent by October 8 according to the Federal Reserve H.15 release. The hike did not cause that. Inflation expectations and Treasury supply did. The hike confirmed it, and confirmation is what moves sellers.
Is This Hike Already in Your Deal?
Run your current underwriting against these five questions before you read another paragraph. If you answer no to any of them, your numbers are stale.
- Is your debt quote dated after September 16, 2026, and does it reflect a 10-year above 5 percent?
- Is your going-in cap rate at least 50 basis points above what the same asset traded for in late 2025 in the same submarket?
- Does your debt service coverage ratio still clear 1.25 at the new rate, not the rate you were quoted in the spring?
- Is your exit cap rate at least 50 to 75 basis points higher than your entry cap, not lower?
- Have you stress tested the refinance in year five at an 8 percent rate?
How Does the Fed Rate Reach Your Cap Rate?
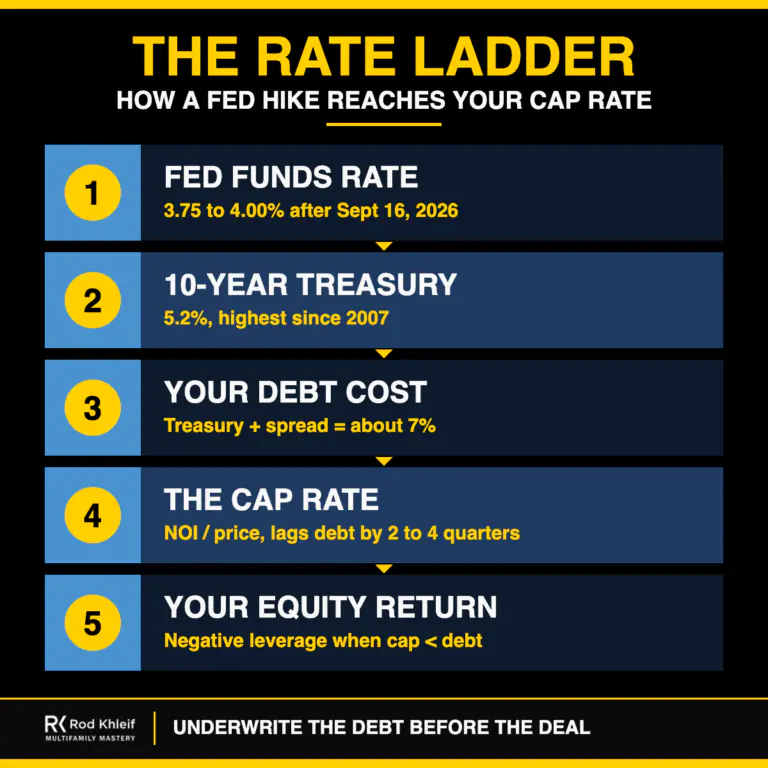
I teach this as the Rate Ladder, five rungs that connect a Fed decision in Washington to the price you can pay for a building in Tampa. Every rung has a lag, and the lags are why cap rates feel sticky when rates jump and sticky again when rates fall. If you want to see the full picture of where target ranges sit by asset class and market, my guide on what a good cap rate for multifamily looks like is the companion to this post.
Want to underwrite a live deal through every rung with me? Join the next Multifamily Bootcamp →
Rung 1: The Fed Funds Rate
The overnight rate banks charge each other, now 3.75 to 4.00 percent. It sets the floor for every floating rate loan tied to SOFR and it signals where the Fed thinks inflation is going. Bridge loans and floating agency debt reprice within weeks of a move. Fixed rate loans do not.
Rung 2: The 10-Year Treasury
The benchmark for fixed rate multifamily debt. It reflects what the bond market expects inflation and growth to be over a decade, which is why it moved before the Fed did. At 5.22 percent on October 8, 2026 it is the highest sustained level since 2007. CBRE’s survey respondents said the 10-year would need to fall back to about 3.75 percent before transaction volume really recovers. We are a long way from there.
Rung 3: Your Debt Cost
Lenders add a spread to the 10-year. Agency spreads run roughly 150 to 200 basis points for a stabilized asset, so a 5.2 percent Treasury turns into a quote near 7 percent. Banks and CMBS price higher. This is the rung you can negotiate, but only within a range, and the range just moved up.
Rung 4: The Cap Rate
A cap rate is net operating income divided by price, or the return you would earn if you paid cash. Over time cap rates track debt costs because buyers cannot pay more than the debt and their equity return allow. In the short run they lag by two to four quarters because sellers anchor to last year’s price and buyers wait. That lag is where the deals get done.
Rung 5: Your Equity Return
The rung that actually pays you. When the cap rate sits below the debt cost, leverage reduces your return instead of boosting it. That is the situation on most Class A and infill deals today, and it is why the math later in this post matters more than any headline.
If you are earlier in your journey and some of these terms are new, my free book walks through cap rate, NOI and debt coverage from the ground up. Click the cover below to download it and keep it open while you work through the examples that follow.

Where Are Multifamily Cap Rates by Class After the Hike?
The best current read is CBRE’s U.S. Cap Rate Survey H1 2026, which collected more than 3,600 cap rate estimates from 200 plus professionals across 50 markets in late June 2026, before the hike. Three findings matter for apartment investors. First, the all-property cap rate held near 6.6 percent, essentially flat from the end of 2025. Second, multifamily compressed more for Class B, Class C and value-add than for Class A and stabilized assets in the first half, because buyers chased yield they could still finance. Third, and this is the warning, respondents flagged multifamily as the sector most likely to see cap rates expand in the second half, with Class C the most exposed and infill multifamily the most bearish subtype. Only 20 percent of respondents expected further compression, down from 42 percent in December.
Coastal markets already moved. CBRE reported stabilized New York multifamily widening from 4.5 to 5.0 percent to 5.0 to 5.5 percent in six months, and coastal cap rates generally up 50 to 100 basis points since late 2025. Here is where going-in cap rates for stabilized assets sit by class as I underwrite them in October 2026, combining the CBRE survey direction with closed trades my team and Warriors have seen.
Read the table from the bottom up. Debt is near 7 percent. Every class above the Class B secondary line is still trading at a cap rate below its cost of debt, which means buyers at those prices are either paying mostly cash, betting on rent growth, or planning to refinance into a rate that does not exist yet. The survey respondents saw the same thing, which is why their expansion expectations for multifamily were, in CBRE’s words, “particularly notable.” For a market-by-market view of the same ranges, the cap rate fundamentals guide and the worked cap rate examples go deeper.
What Happens to a 5.5% Cap Deal When Debt Costs 7%?
This is the question that decides whether you make an offer this quarter. Let me walk you through a 100-unit Class B building the way I would underwrite it in my own shop, then show you the same deal under three different rate assumptions. Follow the six steps and you can reproduce every number with the free Deal Analyzer.
- Start with net operating income, not price. The building collects $2.1 million in rent and other income and runs at a 48 percent expense ratio, which leaves NOI of $1.1 million. Verify that against the trailing twelve months, not the broker’s pro forma.
- Convert NOI to price at the asking cap rate. At a 5.5 percent cap rate the price is $1.1 million divided by 0.055, or $20 million. That is $200,000 a door.
- Size the loan the way the lender will. Ask for 65 percent loan to value, or $13 million, on a 30-year amortization at 7 percent fixed. Annual debt service is $1,037,872.
- Check debt service coverage. NOI of $1.1 million divided by $1,037,872 is a 1.06 coverage ratio. Agency and bank lenders require 1.25. The loan you asked for does not exist.
- Resize the loan to the coverage the lender will accept. At 1.25 coverage the most debt service the property can carry is $880,000, which supports about $11 million of debt at 7 percent. Loan to value drops to 55 percent and your equity requirement rises from $7 million to $9 million.
- Calculate what the equity actually earns. NOI of $1.1 million minus $878,000 of debt service leaves $222,000 of cash flow on $9 million of equity. That is a 2.5 percent cash-on-cash return before capital reserves, on a building you paid a 5.5 percent cap for. Leverage cost you three points of yield.
That last number is negative leverage in one sentence: when your debt costs more than your cap rate, every dollar you borrow lowers your return. The fix is not a better lender. It is a lower price. Here are the three scenarios side by side.
Three Scenarios for the Same 100 Units
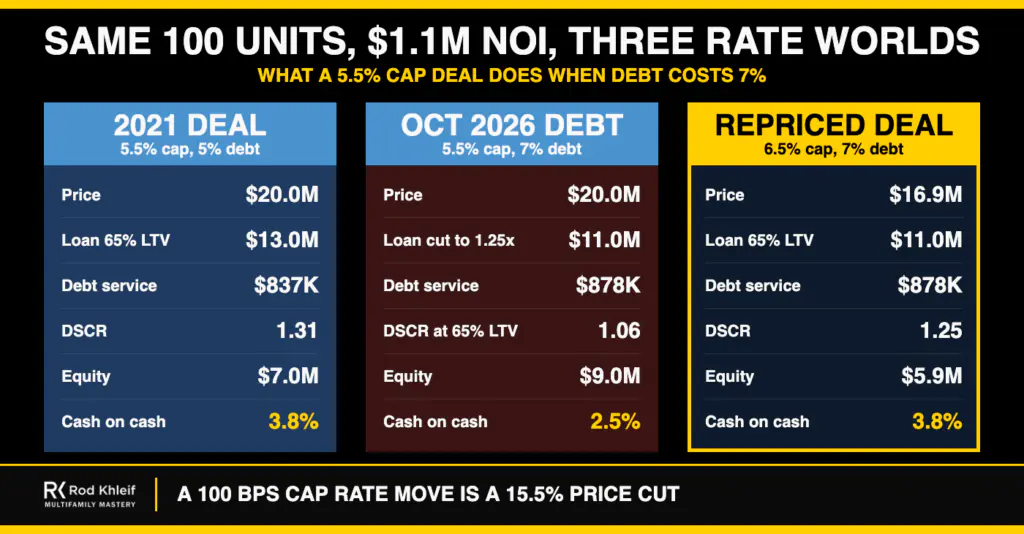
Scenario one is the deal everyone bought in 2021: a 5.5 percent cap with 5 percent debt, 1.31 coverage and a 3.8 percent cash-on-cash return before rent growth, which is the return that let value-add buyers push to 15 percent internal rates of return. Scenario two is the same price with October 2026 debt at 7 percent, where coverage collapses to 1.06, the lender cuts the loan to $11 million, and cash-on-cash falls to 2.5 percent on $2 million more equity. Scenario three is the price the market needs to clear: at a 6.5 percent cap the same NOI is worth $16.9 million, the 65 percent loan is $11 million, coverage lands at 1.25, and the 3.8 percent cash-on-cash return comes back on $5.9 million of equity. The 100 basis point move in cap rate is a 15.5 percent drop in price. That is the trade the Fed just forced, and the seller who accepts it first is the seller you want to be talking to.
Two more sensitivities you should run before any offer. First, the exit. If you buy at 6.5 percent and sell in year five at 7.0 percent, you need about 9 percent cumulative NOI growth just to sell at your purchase price. Second, the refinance. If your five-year loan matures with the 10-year still above 5 percent, your new debt will cost 7 percent or more, so underwrite the refinance at the current rate and treat anything lower as upside. My guide on recession proofing a multifamily portfolio covers the reserve and debt structure that lets you survive both.
How Should You Underwrite Each Class Now?
The hike does not make every class a bad buy. It makes the 2021 assumptions a bad buy. The table below is how my team has reset the underwriting defaults by class since September 16, and it is the single most useful thing you can copy from this post into your own model.
Notice that none of these defaults say “do not buy.” They say “buy at the price that works with 7 percent debt.” Class B and C in secondary markets are the first assets to clear that bar, which is exactly where the Warriors who are closing deals this fall are finding them, usually from sellers facing a 2021 loan maturity. If you want more on how the Fed’s own data feeds into those decisions, the most affordable rental markets post shows where rent still covers the new debt.
Reactive Investor vs Rate Ladder Investor
I have watched two kinds of investors go through every rate cycle since the early 1990s. One reacts to the headline. The other works the ladder. Here is how they behave in the weeks after a hike like this one.
- Reactive: stops looking at deals because “rates are too high,” then re-enters eighteen months later at a higher price. Rate Ladder: keeps underwriting every week at the new debt cost and makes offers at the cap rate that works, knowing most will be rejected and a few will not.
- Reactive: chases floating rate bridge debt to make the numbers fit. Rate Ladder: uses fixed rate debt sized to 1.25 coverage, with a rate cap on anything floating.
- Reactive: models a refinance into 5 percent money in year three. Rate Ladder: models the refinance at 8 percent and treats a lower rate as a bonus.
- Reactive: argues with sellers about the Fed. Rate Ladder: shows sellers the debt quote and the coverage math, and lets the lender be the bad guy.
- Reactive: waits for the 10-year to fall to 3.75 percent, the level CBRE’s respondents said would revive volume. Rate Ladder: buys the motivated seller now, because when the 10-year does fall, cap rates compress and the discount disappears.
What I Am Doing With My Own Portfolio
I lost a large portfolio in 2008 because I believed values only moved one direction and I let the debt tell me what to pay. I am not doing that again, and I do not want you to either. Since the September hike my team has done three things. We re-quoted every piece of floating debt and bought rate caps where the coverage was within 10 basis points of the covenant. We moved our exit cap assumptions up 75 basis points on every deal in the pipeline, which killed two offers and made us walk from a third. And we doubled the number of letters of intent we send, at prices that work with 7 percent debt, because the sellers who need to transact before a 2027 maturity are starting to answer.
The investors in my program who are closing right now are not finding 2021 prices. They are finding Class B assets in secondary markets at 6.5 to 7.25 percent caps from sellers who bought in 2021 with floating debt and cannot refinance. Those deals carry at 1.25 coverage on day one with real cash flow. You can hear several of those conversations on the Lifetime Cash Flow podcast, where I bring on the lenders and operators who are actually pricing this market.
Rod Khleif: “The Fed does not set your cap rate. Your lender’s coverage ratio does. When debt costs 7 percent, the only question is whether the seller or the buyer eats the difference, and the one who understands the math first is the one who does not.”
Fed Rate vs Cap Rates FAQ
Q: What is the difference between the fed rate and a cap rate?
A: The fed funds rate is the overnight interest rate the Federal Reserve targets for loans between banks, 3.75 to 4.00 percent as of September 16, 2026. A cap rate is a property’s net operating income divided by its price, the return you would earn paying cash. The Fed rate influences borrowing costs, and borrowing costs push cap rates over time.
Q: Do cap rates go up when the Fed raises rates?
A: Usually, but with a lag of two to four quarters. Higher Fed rates push the 10-year Treasury and lender spreads up, which raises debt costs, and buyers cannot pay as much, so cap rates rise. CBRE’s H1 2026 survey found 17 percent of respondents expecting expansion in the next six months, up sharply from December, with multifamily the most exposed sector.
Q: What did the Fed do on September 16, 2026?
A: The FOMC raised the federal funds target range by 25 basis points to 3.75 to 4.00 percent on a 12 to 0 vote, the first increase since July 2023. The statement said inflation remains elevated, and the median projection of 4.1 percent for year end 2026 implies one more hike.
Q: Where is the 10-year Treasury yield now?
A: The 10-year closed at 5.22 percent on October 8, 2026 per the Federal Reserve’s H.15 release, after touching 5.04 percent intraday on September 15 and 5.27 percent on September 29, the highest sustained levels since 2007. It was 4.67 percent at its May peak.
Q: What is negative leverage in multifamily?
A: Negative leverage is when your cost of debt is higher than the cap rate you paid. Borrowing at 7 percent to buy a 5.5 percent cap lowers your cash-on-cash return below what you would earn paying all cash. The cure is a lower purchase price, lower leverage, or NOI growth that outruns the gap.
Q: What cap rate do I need when debt costs 7 percent?
A: To hold 1.25 debt service coverage at 65 percent loan to value with 7 percent, 30-year amortizing debt, the going-in cap rate needs to be about 6.5 percent. At 5.5 percent the loan shrinks to roughly 55 percent of value and cash-on-cash falls to about 2.5 percent.
Q: Are multifamily cap rates going up in 2026?
A: In coastal and gateway markets they already have, by 50 to 100 basis points since late 2025 according to CBRE, with stabilized New York multifamily now at 5.0 to 5.5 percent. Secondary market Class B and C moved less in the first half, but CBRE’s respondents expect multifamily, and Class C especially, to see the most expansion in the second half.
Q: Should I wait for the Fed to cut before buying apartments?
A: Waiting for cuts usually means paying more. When rates fall, cap rates compress and sellers raise prices, so the discount you get from a motivated seller today disappears. The better approach is to buy at a cap rate that works with 7 percent debt now, with fixed rate financing, and treat future cuts as upside on the refinance.
Q: How does the Fed rate affect floating rate multifamily loans?
A: Floating loans are priced off SOFR, which tracks the fed funds rate almost immediately. A 25 basis point hike raises your monthly payment within the next reset. If you hold floating debt, buy a rate cap and confirm your coverage ratio still clears the loan covenant at the new rate.
Q: What is the best tool to check a deal against the new rates?
A: Rebuild the deal from NOI with current debt quotes. The free Rod Khleif cap rate calculator gives you the going-in and exit math, and the free Deal Analyzer runs coverage, cash-on-cash and the refinance test at any rate you enter. Use a 7 percent fixed rate and 1.25 coverage as your October 2026 defaults.
Ready to Take the Next Step?
Rate cycles are where fortunes are made in this business, and they are made by the investors who keep underwriting when everyone else stops. The Multifamily Bootcamp is two live days of exactly this: real deals, real debt quotes, and the coverage math worked in front of you so the next hike never catches you with stale numbers.
Want to run your own deal before then? Download the free Multifamily Deal Analyzer, plug in a 7 percent rate and 1.25 coverage, and see what your target property is really worth today.
Not ready for a live event yet? Start with the free book. It covers cap rates, NOI and debt coverage from the first chapter.
Download the free book: How to Create Lifetime Cashflow Through Multifamily Properties →
Disclaimer: This article was written with the help of AI and reviewed by Rod and his team. Rate and cap rate figures are drawn from the cited Federal Reserve and CBRE sources as of October 2026 and change daily. The scenarios are illustrative and do not describe any specific property. Nothing here is investment, legal or tax advice.
