If you’ve spent any time researching multifamily real estate investing, you’ve encountered the term “cap rate” repeatedly. But do you truly understand what it means, how it’s calculated, and most importantly, how to use it to make smarter investment decisions?
Many investors can recite the basic formula, yet struggle to apply cap rates in real-world situations. They don’t understand why a 5% cap rate might be excellent in one market but terrible in another, or how cap rate compression can make or break their investment returns.
This comprehensive guide will demystify capitalization rates once and for all. We’ll break down the formula, walk through detailed examples, explore how cap rates change across market cycles, and show you exactly how savvy investors use this metric to identify winning deals and avoid costly mistakes.
What Is a Cap Rate?
A capitalization rate (cap rate) is the ratio between a property’s net operating income (NOI) and its purchase price or current market value. Expressed as a percentage, the cap rate represents the annual return on investment you’d receive if you purchased the property entirely with cash, meaning no debt.
Think of the cap rate as the property’s yield. A 6% cap rate means the property generates annual income equal to 6% of its value. Just as a bond might yield 4% annually, a multifamily property yielding 6% provides a baseline return before considering leverage, appreciation, or tax benefits.
Cap rates serve multiple critical functions in real estate investing. They provide a quick valuation shortcut, enable property comparisons across markets, indicate market sentiment and risk perception, help time acquisitions and dispositions, and signal when markets are overheated or undervalued.
The Cap Rate Formula: Breaking It Down
The basic cap rate formula is deceptively simple:
Basic Formula
Cap Rate = Net Operating Income ÷ Property Value
Or expressed as a percentage:
Cap Rate = (NOI ÷ Property Value) × 100
Let’s define each component precisely to avoid confusion.
Net Operating Income (NOI)
Net Operating Income is the property’s annual income after paying all operating expenses but before debt service and capital expenditures. The NOI calculation follows this structure:
Start with Gross Potential Income (total possible rent if 100% occupied at market rates). Subtract Vacancy Loss (unoccupied units and collection losses) to get Effective Gross Income. Then subtract Operating Expenses (property management, utilities, repairs, insurance, property taxes, marketing, administrative costs) to arrive at Net Operating Income.
Critically, NOI excludes debt service (mortgage payments), capital expenditures (major improvements like roof replacement), income taxes, and depreciation. These items don’t factor into cap rate calculations because cap rates measure property performance independent of financing and ownership structure.
Property Value
Property value in the cap rate formula can mean either purchase price when analyzing an acquisition or current market value when evaluating an existing holding. Using purchase price calculates your “going-in cap rate”—the initial yield you’re buying. Using current market value calculates today’s cap rate based on what the property would sell for now.
This distinction matters enormously. A property purchased at a 7% cap rate might now trade at a 5% cap rate if NOI increased or market cap rates compressed, representing significant appreciation.
Cap Rate Calculation Examples
Let’s work through progressively complex examples to build intuition around cap rate calculations.
Example 1: Simple Cap Rate Calculation
You’re evaluating a 50-unit apartment building with the following financials:
| Income/Expense Item | Annual Amount |
|---|---|
| Gross Potential Rent | $600,000 |
| Vacancy Loss (5%) | -$30,000 |
| Effective Gross Income | $570,000 |
| Operating Expenses | -$228,000 |
| Net Operating Income | $342,000 |
The seller is asking $4,857,143 for the property.
Cap Rate Calculation:
- Cap Rate = $342,000 ÷ $4,857,143
- Cap Rate = 0.0704 or 7.04%
This means the property generates annual income equal to approximately 7% of its purchase price. If you bought this property with all cash, you’d earn a 7% annual return before considering appreciation, principal paydown, or tax benefits.
Example 2: Reverse Engineering Property Value
Now let’s flip the formula. Suppose you know that similar properties in the market are trading at 6% cap rates, and you’ve identified a property generating $400,000 in NOI. What should you pay?
Property Value = NOI ÷ Cap Rate
- Property Value = $400,000 ÷ 0.06
- Property Value = $6,666,667
This reverse calculation is incredibly powerful. Once you determine the prevailing market cap rate through comparable sales, you can quickly estimate any property’s value based on its NOI. This creates a simple valuation shortcut that experienced investors use to screen hundreds of opportunities rapidly.
Example 3: The Impact of Small Cap Rate Changes
Here’s where cap rates become truly fascinating. Small changes in cap rates create massive value swings. Let’s use the same $400,000 NOI property:
| Cap Rate | Property Value | Value Change |
|---|---|---|
| 7.0% | $5,714,286 | Baseline |
| 6.5% | $6,153,846 | +$439,560 (+7.7%) |
| 6.0% | $6,666,667 | +$952,381 (+16.7%) |
| 5.5% | $7,272,727 | +$1,558,441 (+27.3%) |
| 5.0% | $8,000,000 | +$2,285,714 (+40.0%) |
Notice that a 2-point cap rate compression from 7% to 5% creates a 40% increase in property value—without changing the property’s income at all. This phenomenon, called cap rate compression, is why investors obsess over market cap rate trends and why buying in markets poised for compression can generate enormous returns.
Example 4: Real-World Deal Analysis
Let’s analyze a complete acquisition to see how cap rates work in practice.
Property Details:
- 100-unit multifamily property
- Average rent: $1,200/month per unit
- Physical occupancy: 92%
- Market cap rate: 6.25%
Income Analysis:
| Line Item | Calculation | Annual Amount |
|---|---|---|
| Gross Potential Income | 100 units × $1,200 × 12 months | $1,440,000 |
| Vacancy Loss (8%) | Historical average | -$115,200 |
| Other Income | Parking, laundry, pets | +$36,000 |
| Effective Gross Income | $1,360,800 |
Expense Analysis:
| Expense Category | Annual Amount | % of EGI |
|---|---|---|
| Property Management | $54,432 | 4.0% |
| On-site Payroll | $68,040 | 5.0% |
| Repairs & Maintenance | $95,256 | 7.0% |
| Utilities | $68,040 | 5.0% |
| Insurance | $27,216 | 2.0% |
| Property Taxes | $190,512 | 14.0% |
| Marketing & Admin | $40,824 | 3.0% |
| Total Operating Expenses | $544,320 | 40.0% |
NOI Calculation:
- Effective Gross Income: $1,360,800
- Less Operating Expenses: -$544,320
- Net Operating Income: $816,480
Property Valuation:
- Property Value = NOI ÷ Cap Rate
- Property Value = $816,480 ÷ 0.0625
- Property Value = $13,063,680
At the prevailing 6.25% market cap rate, this property should trade for approximately $13.1 million. If the seller is asking $14 million, you’re paying a 5.83% cap rate ($816,480 ÷ $14,000,000), which means you’re paying above market rates. Conversely, if you can negotiate $12.5 million, you’re buying at a 6.53% cap rate, below the market rate and potentially creating immediate value.

Want some help? Click here to use Rod Khleif’s FREE cap rate calculator.
Understanding Cap Rate Compression
Cap rate compression occurs when prevailing market cap rates decrease over time, causing property values to increase even without income growth. This phenomenon has driven significant wealth creation in real estate over the past decade.
Why Cap Rates Compress
Several forces drive cap rate compression in real estate markets.
Interest Rate Decline creates the most powerful compression driver. When interest rates fall, investors accept lower yields across all asset classes. As 10-year treasury yields drop from 4% to 2%, investors who previously required 7% cap rates might accept 5% cap rates, maintaining their spread over risk-free rates. This dynamic explains much of the compression seen from 2010-2021.
Improved Market Fundamentals also compress cap rates. Strong job growth, population influx, and limited new construction create investor confidence in future rent growth. When investors believe NOI will grow significantly, they accept lower initial cap rates because their total returns will include substantial appreciation. Markets like Austin, Nashville, and Boise experienced dramatic compression as fundamentals strengthened.
Increased Investor Competition for multifamily assets pushes cap rates down through basic supply and demand. When institutional capital floods into multifamily—driven by stock market volatility, commercial real estate challenges, or demographic trends favoring rentals—the increased buyer competition compresses cap rates. Sellers benefit from multiple aggressive offers bidding prices higher.
Market Maturity and Stabilization naturally compresses cap rates as metros develop. Emerging markets often trade at higher cap rates reflecting higher perceived risk. As these markets mature with improved infrastructure, governance, and economic diversity, investors perceive less risk and accept lower yields. Secondary markets like Columbus, Indianapolis, and Charlotte have seen steady compression as they’ve matured.
Cap Rate Compression Example
Let’s examine compression’s wealth-building impact through a five-year hold scenario:
Purchase (Year 1):
- Purchase Price: $10,000,000
- NOI: $700,000
- Going-In Cap Rate: 7.0%
Year 5 (No Income Growth Scenario):
Assume NOI remains flat at $700,000, but market cap rates compress to 5.5% due to falling interest rates and increased investor demand.
- Sale Price = NOI ÷ Exit Cap Rate
- Sale Price = $700,000 ÷ 0.055
- Sale Price = $12,727,273
Profit from compression alone: $2,727,273 (27.3% gain) without any operational improvement.
Year 5 (With Income Growth Scenario):
Now assume you also grow NOI by 4% annually through rent increases and expense management:
- Year 5 NOI = $700,000 × (1.04)^5
- Year 5 NOI = $851,730
- Sale Price = $851,730 ÷ 0.055
- Sale Price = $15,485,091
Total profit: $5,485,091 (54.9% gain) from combining operational improvements with market compression.
This example illustrates why investors fixate on both operational execution and market timing. Buying in markets poised for compression while executing value-add business plans creates compounding returns far exceeding income alone.
Cap Rate Expansion (The Downside)
Cap rate expansion—when rates increase—works equally powerfully in reverse, destroying value rapidly. Using our initial $10 million property with $700,000 NOI:
| Exit Cap Rate | Sale Price | Loss from Purchase |
|---|---|---|
| 7.0% (unchanged) | $10,000,000 | $0 (0%) |
| 7.5% | $9,333,333 | -$666,667 (-6.7%) |
| 8.0% | $8,750,000 | -$1,250,000 (-12.5%) |
| 8.5% | $8,235,294 | -$1,764,706 (-17.6%) |
| 9.0% | $7,777,778 | -$2,222,222 (-22.2%) |
Even with stable operations, rising cap rates can eliminate years of income and force losses upon sale. This happened to many investors who bought at peak pricing in 2006-2007 and were forced to sell during the 2009-2010 downturn when cap rates spiked.
Cap Rates Across Market Cycles
Understanding how cap rates behave throughout real estate cycles is essential for timing acquisitions and exits strategically.
The Four Phases of Real Estate Cycles
Phase 1: Recovery (Rising Cap Rates → Falling Cap Rates)
Following a downturn, markets begin recovering. Vacancy decreases, rents stabilize, and investor confidence gradually returns. Cap rates remain elevated but start declining slowly as distressed selling ends and investors recognize recovery. This phase offers excellent buying opportunities—cap rates are still high but beginning their descent.
Investor Strategy: Aggressive acquisition. Buy at high cap rates before compression accelerates. Focus on fundamentally strong markets showing early recovery signs like job growth and declining vacancy.
Phase 2: Expansion (Falling Cap Rates, Strong NOI Growth)
The market is growing robustly. Rent growth accelerates, vacancy reaches healthy levels, and new construction increases to meet demand. Cap rates compress steadily as investor competition intensifies and confidence peaks. Both NOI growth and cap rate compression drive strong returns.
Investor Strategy: Continue buying quality deals but become increasingly selective. Returns are strong but pay attention to exit cap rate assumptions—don’t expect indefinite compression. Understanding Market Cycles helps time this phase.
Phase 3: Hyper Supply (Low Cap Rates, Slowing NOI Growth)
Markets peak as excessive construction delivers new supply, rent growth slows or stops, and vacancy begins rising. Cap rates reach cyclical lows as investors, still optimistic from recent strong performance, continue paying premium prices. Warning signs emerge but are often ignored.
Investor Strategy: Extreme caution or shift to selling. High prices (low cap rates) combined with deteriorating fundamentals create dangerous conditions. Consider disposition rather than acquisition. When to Sell Your Multifamily Property provides exit timing guidance.
Phase 4: Recession (Rising Cap Rates, Falling NOI)
Economic downturn hits. Vacancy spikes, rent concessions increase, NOI declines, and investor capital retreats. Cap rates expand rapidly as distressed sellers and nervous buyers negotiate from weak positions. Property values fall significantly despite potentially stable operations.
Investor Strategy: Preserve capital and prepare for recovery. Only the most capitalized, experienced investors should pursue opportunistic acquisitions. Most should hold existing assets and avoid forced sales.
Cap Rate Trends by Market Type
Different markets exhibit distinct cap rate patterns based on their risk and growth profiles.
Gateway Markets (Low Cap Rates): Major metros like New York, San Francisco, Los Angeles, and Boston trade at low cap rates (3.5-5%) reflecting stable demand, limited land, high barriers to entry, and institutional investor preference. These markets offer lower yields but also lower volatility and stronger long-term appreciation.
Growth Markets (Moderate Cap Rates): Rapidly growing sunbelt and secondary markets like Austin, Nashville, Phoenix, and Raleigh trade at moderate cap rates (4.5-6%) balancing growth potential against less mature infrastructure and higher volatility. These markets offer compelling risk-adjusted returns when timed well.
Secondary/Tertiary Markets (Higher Cap Rates): Smaller metros and tertiary markets trade at higher cap rates (6-8%) reflecting higher perceived risk, lower liquidity, and less institutional capital. These markets can provide strong cash flow but face greater economic sensitivity and exit challenges.
Value-Add/Opportunistic (Highest Cap Rates): Properties requiring major repositioning or in distressed markets may trade at very high cap rates (8-10%+) based on current income, but investors underwrite to stabilized cap rates after improvements. The spread between in-place and stabilized cap rates represents the value-add opportunity.
How Investors Actually Use Cap Rates
While understanding cap rate mechanics is important, knowing how experienced investors apply this knowledge creates actual value.
Quick Property Valuation
Investors use cap rates for rapid valuation screening. When analyzing dozens of opportunities weekly, you can’t perform exhaustive analysis on every property. Instead, compare the asking price to a quick cap rate calculation.
If you know Charlotte multifamily trades at 5.5% cap rates and find a property with $500,000 NOI asking $8 million, calculate the implied cap rate: $500,000 ÷ $8,000,000 = 6.25%. This property is priced at a higher cap rate (lower price) than market, warranting deeper investigation.
Market Comparison
Cap rates enable apples-to-apples comparison across dramatically different properties. A 50-unit property with $250,000 NOI trading at 6% cap rate ($4,166,667) offers the same yield as a 200-unit property with $1,000,000 NOI also trading at 6% ($16,666,667). Both provide identical unleveraged returns despite different sizes and price points.
This standardization helps investors identify which markets and property types offer the best risk-adjusted returns at any given time.
Underwriting Exit Assumptions
Conservative investors underwrite exit cap rates at or above purchase cap rates, assuming no compression benefit. Aggressive investors might assume 50-100 basis points of compression based on market trends and cycle timing.
Consider a property purchased at 6.5% cap rate with projected Year 5 NOI of $600,000:
Conservative Exit (6.5% cap rate):
- Sale Price = $600,000 ÷ 0.065 = $9,230,769
Moderate Exit (6.0% cap rate):
- Sale Price = $600,000 ÷ 0.060 = $10,000,000
Aggressive Exit (5.5% cap rate):
- Sale Price = $600,000 ÷ 0.055 = $10,909,091
The difference between conservative and aggressive assumptions is $1,678,322—dramatically impacting projected returns. Savvy investors stress-test multiple exit scenarios to understand their risk exposure.
Identifying Value-Add Opportunities
Cap rates help quantify value-add potential by comparing in-place to stabilized valuations:
Current State:
- In-Place NOI: $400,000
- Market Cap Rate: 6%
- Current Value: $6,666,667
After Stabilization:
- Stabilized NOI: $550,000 (through rent increases and expense reduction)
- Market Cap Rate: 6%
- Stabilized Value: $9,166,667
The $2,500,000 value creation opportunity ($9,166,667 – $6,666,667) justifies renovation investment and effort. If you can buy the property for $6.5 million and spend $800,000 on improvements, your all-in basis is $7.3 million against a stabilized value of $9.17 million, creating $1.87 million in equity.
Cap Rate Limitations and Misconceptions
Despite their utility, cap rates have significant limitations that investors must understand to avoid costly errors.
What Cap Rates Don’t Tell You
Cap rates ignore financing impact entirely. A property at 6% cap rate provides very different returns at 3% interest versus 7% interest. Cash-on-cash return, which accounts for leverage, matters more for actual investor returns than cap rate alone.
Cap rates don’t account for capital expenditures. A property might show a strong 7% cap rate but need a $1 million roof replacement immediately. NOI-based metrics miss these one-time expenses that dramatically affect returns.
Cap rates ignore appreciation potential. Two properties at identical 6% cap rates might have vastly different total returns if one is in a high-growth market appreciating 8% annually while the other is in a stagnant market with flat values.
Cap rates don’t reflect property condition or deferred maintenance. A property with extensive deferred maintenance might trade at a higher cap rate (lower price) than a renovated property in the same market. The cap rate difference reflects not just yield but also required future investment.
Cap rates vary dramatically by property quality within markets. Class A properties in the same market might trade at 4.5% while Class C properties trade at 7%. These aren’t comparable investments—different tenant bases, risk profiles, and growth trajectories justify different cap rates.
Common Cap Rate Mistakes
Mistake 1: Comparing Cap Rates Across Different Markets
A 5% cap rate in San Francisco and a 5% cap rate in Birmingham, Alabama represent fundamentally different risk-return profiles. San Francisco’s lower volatility, higher barriers to entry, and stronger appreciation potential justify lower yields. Birmingham’s higher risk justifies higher current income.
Mistake 2: Using Proforma NOI Instead of In-Place NOI
Sellers often advertise properties using “proforma” or “stabilized” NOI showing potential income after improvements. This inflates the cap rate and makes the price appear more attractive. Always calculate cap rate using actual trailing twelve-month NOI to understand what you’re truly buying.
Mistake 3: Ignoring Market Context
A 7% cap rate isn’t inherently “good” or “bad”—context matters entirely. During an expansion phase with 5% prevailing cap rates, a 7% cap rate might signal significant property problems. During a recession with 9% prevailing cap rates, a 7% cap rate might be expensive.
Mistake 4: Assuming Cap Rates Always Compress
Many investors who bought properties from 2020-2022 at historically low cap rates (often 3-4% in major markets) assumed compression would continue indefinitely. Rising interest rates in 2022-2023 caused significant cap rate expansion, creating paper losses for recent buyers. Cap rates are cyclical, not linear.
Cap Rate Strategy: Putting It All Together
Successful investors develop sophisticated cap rate strategies that integrate market analysis, cycle timing, and portfolio management.
When to Accept Lower Cap Rates
Lower cap rates (higher prices) can be justified when market fundamentals suggest strong future growth, barriers to entry limit competition, property quality commands premium tenants and rent growth, you’re early in the market cycle with compression ahead, or financing terms are exceptionally favorable, improving leveraged returns despite low cap rates.
When to Demand Higher Cap Rates
Higher cap rates (lower prices) are necessary when markets are late in the cycle with expansion likely, significant capital expenditures are required, property or market quality is lower, exit markets are less liquid, or economic uncertainty is elevated.
Portfolio Approach
Sophisticated investors build portfolios balancing cap rate strategies. Core holdings in gateway markets at low cap rates (4-5%) provide stability and consistent appreciation. Growth market investments at moderate cap rates (5-6.5%) balance yield and growth. Value-add opportunities at higher cap rates (6.5-8%) based on in-place income offer outsized returns through operational improvement.
This diversification across cap rate bands creates portfolio resilience while capturing upside from different strategies and market conditions.
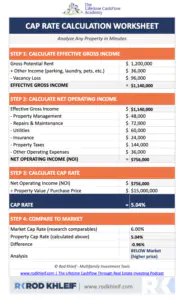
Cap Rate Calculation Worksheet
Use this simple framework to calculate and analyze cap rates for any property:
Step 1: Calculate Effective Gross Income
- Gross Potential Rent: $__________
- Other Income: $__________
- Vacancy Loss: -$__________
- Effective Gross Income: $__________
Step 2: Calculate Net Operating Income
- Effective Gross Income: $__________
- Property Management: -$__________
- Repairs & Maintenance: -$__________
- Utilities: -$__________
- Insurance: -$__________
- Property Taxes: -$__________
- Other Operating Expenses: -$__________
- Net Operating Income: $__________
Step 3: Calculate Cap Rate
- Net Operating Income: $__________
- ÷ Property Value: $__________
- = Cap Rate: _________%
Step 4: Compare to Market
- Market Cap Rate: _________%
- Property Cap Rate: _________%
- Difference: _________%
- Conclusion: ☐ Above Market ☐ Below Market ☐ At Market
Click here to download Rod Khleif’s Cap Rate Calculation Worksheet
Final Thoughts
Cap rates represent far more than a simple formula—they’re a lens through which experienced investors view markets, time investments, and evaluate opportunities. Understanding not just how to calculate cap rates but how they move across cycles, vary by market, and impact returns separates sophisticated investors from novices.
The most successful multifamily investors combine cap rate analysis with broader market research, cycle timing, operational expertise, and portfolio strategy. They buy when cap rates are high (prices are low) and sell when cap rates are low (prices are high), generating returns from both income and market timing.
As you evaluate your next multifamily investment, remember that cap rates are a starting point, not an ending point. They provide quick valuation guidance and market context, but your total returns will depend on financing structure, operational execution, capital expenditure management, market timing, and a dozen other factors.
Master cap rate analysis, but don’t become so focused on this single metric that you miss the bigger picture of building a resilient, profitable real estate portfolio.
Frequently Asked Questions About Cap Rates
What is a good cap rate for multifamily real estate?
There’s no universally “good” cap rate—it depends entirely on market context, property quality, and risk tolerance. Gateway markets like San Francisco or New York might see Class A properties trade at 3.5-4.5% cap rates, while secondary markets like Indianapolis or Memphis might see similar quality properties at 5-6%. Generally, higher cap rates indicate higher risk or lower growth expectations, while lower cap rates suggest stable markets with strong appreciation potential. A good cap rate is one that compensates appropriately for the specific risks you’re taking in that particular market and property type.
How do rising interest rates affect cap rates?
Rising interest rates typically cause cap rates to expand (increase), which means property values decline. This happens because the spread between cap rates and risk-free rates (like the 10-year Treasury) tends to remain relatively constant. If Treasury yields jump from 2% to 5%, investors who previously accepted a 5% cap rate (3% spread) will now demand an 8% cap rate to maintain that same spread. Additionally, higher interest rates increase debt service costs, reducing cash flow and making investors less willing to pay premium prices. This dynamic caused significant value compression in 2022-2023 as the Federal Reserve raised rates aggressively.
Can cap rates be negative?
While theoretically possible, negative cap rates are extremely rare in stabilized multifamily properties and would indicate a property losing money operationally. You might see negative cap rates in development deals where the property isn’t yet generating income, or in rare cases where investors are buying purely for land value or future development potential. If you encounter a negative cap rate on a stabilized property, it’s a massive red flag indicating either operational failure or data errors in your analysis. Don’t confuse negative cap rates with negative cash flow—a property can have a positive cap rate but negative cash flow if debt service exceeds NOI.
What’s the difference between cap rate and cash-on-cash return?
Cap rate measures unleveraged return (as if you bought with all cash) and equals NOI divided by property value. Cash-on-cash return measures actual cash flow return on your invested equity after accounting for debt service. For example, a property at 6% cap rate with 75% financing at 5% interest might generate 12-15% cash-on-cash return because leverage amplifies returns when the cap rate exceeds the interest rate. Conversely, if interest rates are 7%, that same property would show negative cash flow despite the positive cap rate. Cap rate is useful for property valuation and comparison, while cash-on-cash return matters more for actual investor returns.
How often do cap rates change?
Cap rates change constantly in response to market conditions, though the pace varies by market liquidity and economic volatility. In highly liquid gateway markets with frequent transactions, cap rates might shift monthly as new sales establish pricing benchmarks. In smaller markets with fewer transactions, cap rate movements appear choppier and less frequent. Major shifts typically occur during economic transitions—cap rates compressed steadily from 2010-2021 as interest rates fell and investor demand increased, then expanded rapidly in 2022-2023 as rates rose. Within these long-term trends, cap rates fluctuate based on property-specific factors like lease expirations, deferred maintenance, or neighborhood changes.
Should I buy properties with higher or lower cap rates?
The answer depends on your investment strategy and market timing. Higher cap rates mean lower purchase prices and better immediate cash flow but often indicate higher risk, slower growth markets, or properties requiring significant work. Lower cap rates mean paying premium prices for lower immediate yield but often provide more stability, stronger appreciation potential, and lower volatility. Conservative investors in uncertain markets might prefer higher cap rates for cash flow cushion, while growth-oriented investors in strong markets might accept lower cap rates betting on appreciation and rent growth. The best strategy is often diversifying across both—core holdings at low cap rates for stability, value-add opportunities at high cap rates for upside.
How do you calculate cap rate if a property has multiple buildings or mixed-use components?
Calculate cap rate using the total NOI from all income-producing components divided by the total property value. For a mixed-use property with apartments, retail, and office space, sum the NOI from each component (remembering that retail and office NOI calculations differ from multifamily) and divide by the total acquisition price. However, recognize that different components might have different risk profiles and cap rates if sold separately—retail might trade at 6% while multifamily trades at 5% in the same market. For portfolio analysis or comparison purposes, you might calculate individual cap rates for each component to understand the blended rate, but for acquisition decisions, use the total NOI and total price for your overall cap rate.
Multifamily Investing Terms: The Complete Glossary – Reference guide for all essential real estate investment terminology.
Disclaimer: This article was written with the help of AI and reviewed by Rod and his team.
